Background
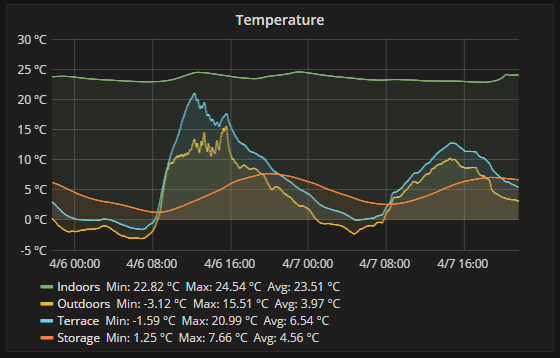
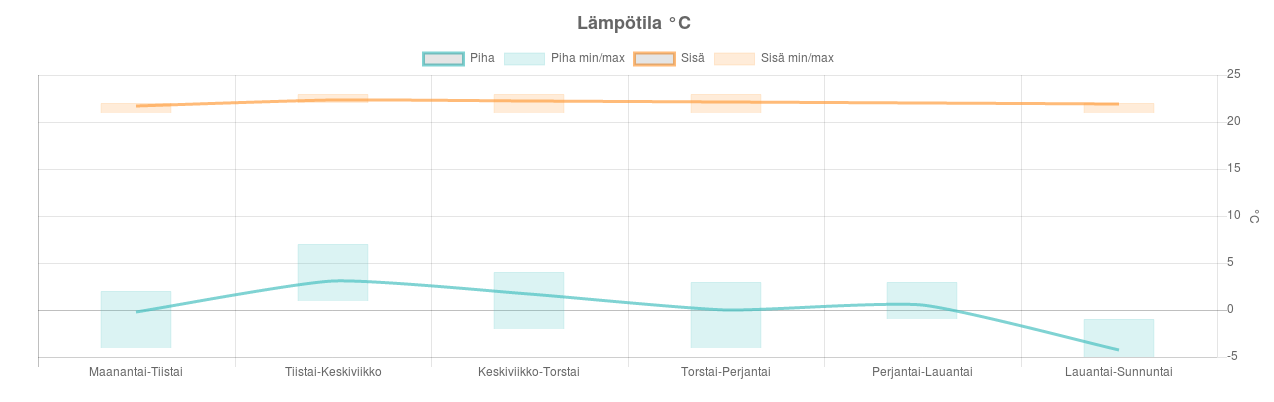
I have been using Grafana and InfluxDB and other time-series databases before for drawing all kinds of graphs, so this was naturally the first project I did with the RuuviTags when I got my hands on them. Long story short, the graphs are viewable live here (there are also some additional dashboards both related to Ruuvi and my other projects found behind that link, for example what the climate in a sauna looks like)
Project
There are basically three key components:
- RuuviCollector application (such an innovative name..) which is an application I wrote that collects measurements from RuuviTags, parses them, and pushes to InfluxDB
- InfluxDB which is a time-series database for long-term storage for the measurements
- Grafana which renders pretty graphs about these measurements stored
RuuviCollector
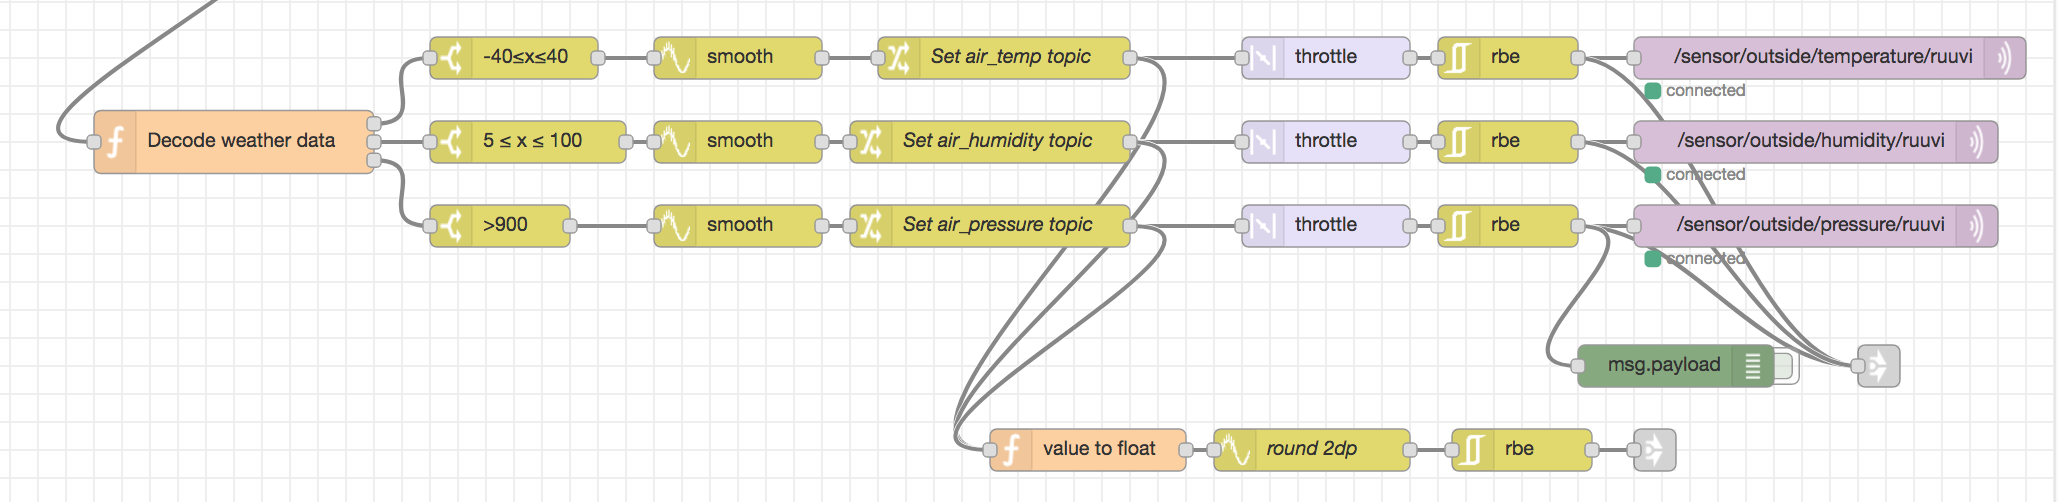
Probably the “heart” of this project is this little collector application, it’s written in Java and originally put together in just a couple of hours, reusing parts of my other similar coding projects which utilized InfluxDB as storage as well. In simplicity, it uses hcitool and hcidump from the bluez and bluez-hcidump packages to scan for BLE traffic and dump the raw packets. Ruuvi beacons are detected from the traffic and the sensor data is parsed from them and finally pushed to InfluxDB after adding some metadata such as identification of the physical tag and the format of the sensor data.
At the moment of writing this, a lot of improvements, code cleanups and writing documentation is to be done, but for those who have some “techy knowledge” can head over to the github page and try the application.
The setup
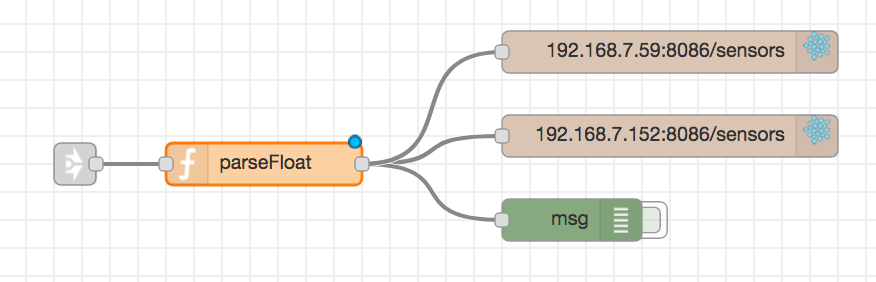
In my setup, the RuuviCollector is running on a Raspberry Pi 3 running Raspbian, and InfluxDB and Grafana are running on my dedicated server. As both RuuviCollector and Grafana communicate with InfluxDB over http(s), it’s possible to have these set up in physically different locations. Any device, computer or home server can be used to run the collector, as long as bluez, bluez-hcidump and Java 8 are available on the system, and naturally a bluetooth adapter supporting BLE is present. It is also possible to run this entire setup completely all on one single Raspberry PI 3.
I use the latest weather-station firmware (found here) on the RuuviTags in high-precision mode, which also reports the accelerometer readings as well as the battery voltage. The ‘default’ mode in weather station firmware reports measurements at a reduced accuracy to avoid spamming nearby phones when the temperature changes 0.01⁰C. The high precision mode reports the measurements as “Manufacturer specific data” rather than the plain Eddystone-URL so the beacons won’t pop up on nearby phones.
Most likely I forgot to mention something relevant, so feel free to ask questions if you have any. ![]()


 Works now.