Collecting RuuviTag measurements and displaying them with Grafana

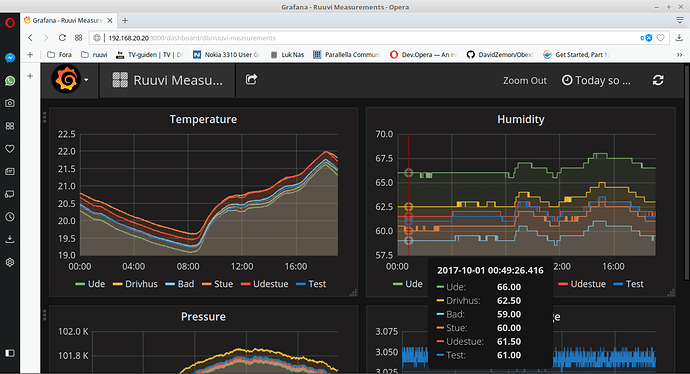
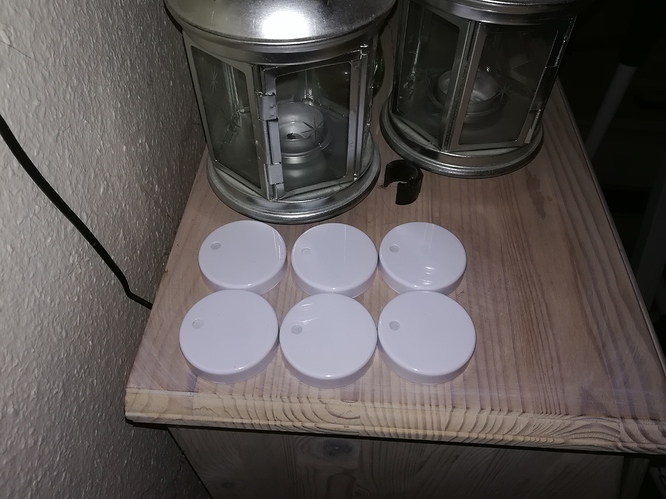
First a picture of the location of the 6 ruviiā€™s.


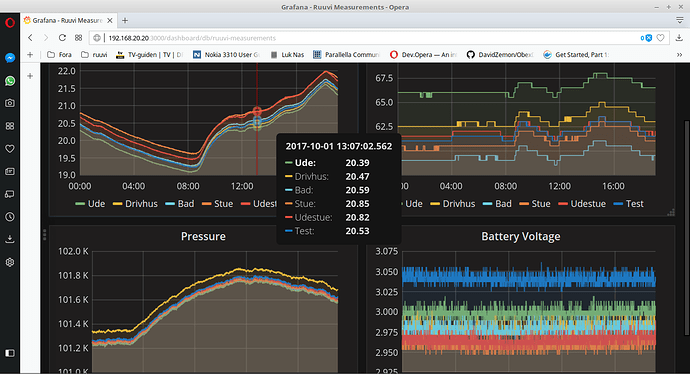
Then a picture of the temperature difference.

And finally a picture of the humidity.

Itā€™s fun as the temperature is different from falling to rising temperature.

I would use these ruuviā€™s for dehumidification, but what should I trust,
since the smallest is 61% and the largest is 66%.
The measurements are taken in the same room on the same furniture.

So I have to go for some who do not differ.
Or is there an opportunity to calibrate them to show the same?

And Iā€™ve updated everyone to the latest software Beta version.

This is something we have also thought about but havenā€™t tried. The Bosch sensor is factory-calibrated and its absolute accuracy is pretty good compared to several other sensor options. However, if one would like to add some offset fixes, it can be done either on collector or firmware side.

Move the Tags somewhere else, open the enclosures, redo the test and add some offset calibration values to make them all look same and then run more tests? According the photo, the test environment wasnā€™t perfect. For example, the devices close to the wall might see a bit different temperature the others.

I have noticed that it would better to open enclosures after taking them from different environments.
Air is not changing so fast inside the enclosure that it can take long time before values are ā€œstabilizedā€ to same level.

Walls have surprisingly high effect on the temperature near them especially if the space on the other side of the wall is of different temperature or if there is a heat source inside the room. Humans typically wont be even able to detect this, but itā€™ll show up on tags for sure.

Another thing to keep in mind is that the relative humidity depends on both the absolute amount of water in the air (abs. humidity) and temperature, so ā€œdifferentā€ temperatures in the same room will have different relative humidity even though they have the same absolute humidity.

For example, 60% relative humidity at 20Ā°C has about 10.4 g/mĀ³ absolute humidity. This same air when heated only one degree more, to 21Ā°C, will now have a relative humidity of about 56.6% while the absolute humidity stays at about 10.4 g/mĀ³.

1 Like

Iā€™ve had them in a few days before I took the measurements.
Now I move them into a closet and take off the lid and leave them for a few days.

1 Like

HI otso

I have a RPI3 with this image on it , Grafana is working ,influx too , i changed the mac adress in grafana but no datas are displaying ,

Did i forgot any step to make it work ?

Should i use a Bluetooth dongle or RPI3 BT is compatible ?

should i run the tag in raw mode or normal mode ?

thx

RPI3 builtin Bluetooth is compatible. Both modes should work, but raw mode will provide more precision and additional metrics (like the acceleration for example).

First you should check the time on the Raspberry PI and the time selection in Grafana, as the measurements are stored using the time on the device while Grafana will display times based on the time of the browser accessing it, so if these mismatch by a lot, the data may be somewhere far off, out of sight.

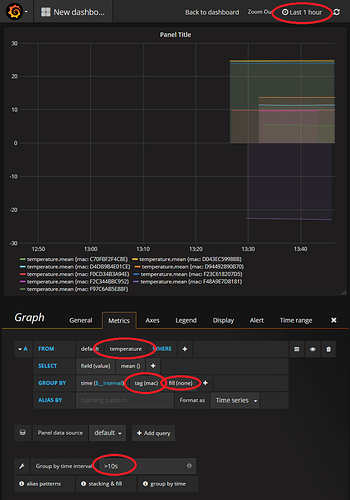
Second thing to try is to set a lower limit in the ā€œGroup by time interval:ā€ near the bottom of the page when editing a graph, this value should be roughly the same or little higher as the measurement collection interval, for example ā€œ>10sā€.

Setting too low value may create unwanted gaps in the graph or make the entire graph invisible, and too high value will make the graph resolution low.

Checked but , still nothing , i think i missed somthing propably with ruuvicollector ? nothing to setup here ?

I just freshly set up the image on a RPI3 with the following steps:

  • Prepare the MicroSD card with the image and boot it up on a RPI3

  • SSH to the system, or use the terminal if you have a mouse, a keyboard and a display attached

  • Enable the Grafana with sudo systemctl enable grafana-server (this step should be made obsolete in the future)

  • Check that the time on your RPI is correct, you can use the date command in terminal or via SSH. (if the RPI has access to the internet, the time should be updated automatically to UTC time, this is fine even if you are on a different timezone, as Grafana will convert the times to local timezone anyway)

  • NOTE! if you set the time and date manually, make sure to properly set the timezone as well, because the measurement timestamps are converted to UTC and this will go wrong if your timezone is wrong

  • Point your browser to the IP your RPI has, if you get a ā€œservice temporarily unavailableā€, wait for a little bit, it takes a moment for Grafana to start up and for Apache to notice itā€™s up.

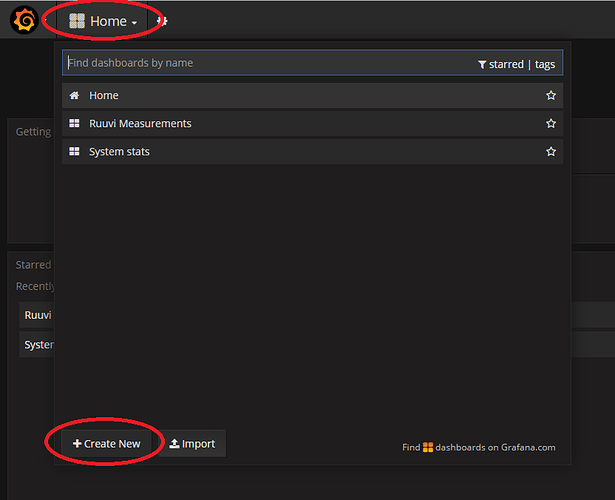
  • Once you have the Grafana default dashboard visible, log in as admin and create a new dashboard (or modify an existing one)

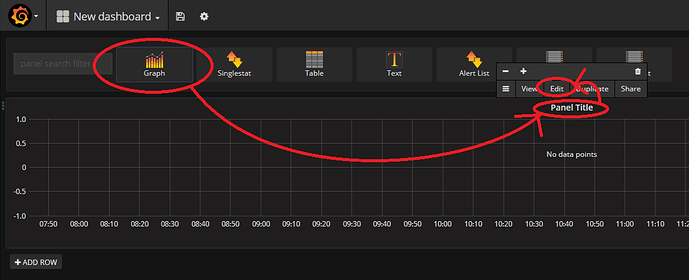
  • Create a new Graph panel and open the editor

  • Adjust the panel settings; choose the metric (eg. temperature), add a GROUP BY clause so Grafana understands how to group measurements from different sources (or alternatively add a WHERE clause to pick a specific mac), change the fill function to ā€˜noneā€™ (this will linearly interpolate gaps in the graphs to make them consistent), and add a lower limit to the Group by time interval. It may be useful to choose a shorter timespan from top right while testing.

Note: All passwords are the default ones, so you really should change these if you make your RPI accessible from the public internet.

3 Likes

Checked all this , still donā€™t workā€¦i have no skills in linux , can i ask you something in private plz ?

Have you checked that the tags actually transmit anything? For example with nRF Connect mobile app. You can also send me a private message if you wish.

It works perfectly on my phone , i would like to send you a private message but how to do that ?

Please keep the posts public, as it helps everyone.

I just wanted to send him my ip adress in private , so he can check by himself , sorry i have no linux skillsā€¦

You configure the mac adresses only in grafana or elsewhere ?

thx

Configuring addresses in Grafana is enough

Iā€™m wondering what is the most convenient way to add dew point info graph into Grafana? @Scrin has those in his demo, but seems like that data is queried directly from InfluxDB, correct? How did you generated the data?

I tried to calculate dew point directly at Grafana (Td = T - ((100 - RH)/5)), but canā€™t make working syntax.

The math (and other) expressions in Grafana are actually expressions to InfluxDB, and thus they support what InfluxDB supports. Unfortunately InfluxDB itself does not support that advanced maths in the query language, and the method recommended by influxdata (and the method I use) is to use Kapacitor to calculate the values, and store them in a separate measurement.

The streaming tickscript dewpoint.tick that I use for calculating the dew point is:

var temperature = stream
  |from()
    .measurement('temperature')
    .groupBy(*)

var relHumidity = stream
  |from()
    .measurement('humidity')
    .groupBy(*)

temperature
  |join(relHumidity)
    .as('t', 'h')
  |eval(lambda: 243.5 + "t.value", lambda: 17.67 * "t.value", lambda: "v2" / "v1", lambda: exp("v3"), lambda: 6.112 * "v4", lambda: "h.value" / 100.0, lambda: "humiDec" * "equilibriumVaporPressure", lambda: "v5" / 6.112, lambda: log("v6"), lambda: "v7" - 17.67, lambda: -243.5 * "v7", lambda: "v9" / "v8")
    .as('v1', 'v2', 'v3', 'v4', 'equilibriumVaporPressure', 'humiDec', 'v5', 'v6', 'v7', 'v8', 'v9', 'value')
    .keep('value')
  |influxDBOut()
    .database('ruuvi')
    .measurement('dewpoint')

enabled with something like:

kapacitor define dewpoint -type stream -tick dewpoint.tick -dbrp ruuvi.autogen
kapacitor enable dewpoint

(this tickscript assumes you are using the original format of my RuuviCollector and you want to store the dewpoint in a measurement called dewpoint in a database called ruuvi. If you want different, modify accordingly)

(a note for future readers: some day when I have time, I will rework the format used by the RuuviCollector to use multi-value measurements and add dew point and absolute humidity as pre-calculated values by the collector, though donā€™t worry, I will keep the current format as a ā€œlegacy formatā€ available too, since users using older InfluxDB canā€™t use multivalue measurements, as those are not supported by older versions of InfluxDB, and because not all people necessarily want to migrate their databases)
1 Like

Excellent, thanks for the help!

EDIT: Got it working, thanks.

I tried to make Telegram notification, but now successful, here is my tick script
stream
|from()
.measurement(ā€˜temperatureā€™)
|alert()
.crit(lambda: ā€œt.valueā€ < 10)
.message(ā€˜Might want to check your tempā€™)
.telegram()
.chatId (ā€˜123456789ā€™)

Ja nƤillƤ kƤynnistin
kapacitor define telq_alert -type stream -tick telq_alert.tick -dbrp ruuvi.autogen
kapacitor enable telq_alert