https://lab.ruuvi.com/ruuvitag-fw/ , you can find a RasPi 3 image there.
The image requires you to enable grafana (sudo systemctl enable grafana-server.service )
Simple Python -> Influx data collector here, for those who don’t want to use a Java version.
- Under development.
- Linux only, tested on Raspi
- Sensors must be listed and named in sensors.yml to be written to DB.
- All MACs seen are reported and sensors.yml is re-read when changed, so you can add Ruuvis without stopping measurements.
- Ignore the mocking stuff (it creates some fake time series for testing).
1 Like
Hey Scrin and others.
I’m really appreciating this project, but I’m having a bit of an issue. Everything is up and running and the graphs are great, then after seemingly random amounts of time I get “no data points” and the a reset is needed to get things going again.
Is there anything I can do to diagnose the problem as I have very little experience working with these programs.
Thanks
Do you mean the data stops showing up on the graphs until a reset, or does the data collecting stop entirely until reset?
Also, are you using the Raspberry PI image or did you set up the programs by yourself?
I used the Raspberry PI image.
I’m not sure exactly how to answer your question, how would I determine if the data collection is still working? The graphs stop, but I am still able to collect data via an android app so the ruuvi is still transmitting.
Thanks for the help
You can SSH into Raspberry Pi, use influx DB commandline and check the timestamps of latest data for example.
I don’t recall the exact commands, but they were relatively quick to find with Google.
Let us know how it goes 
Have you find a way to get a “constant” ID?
No. It changed once again when I upgraded my Mac Mini to 10.12. It doesn’t seem to change arbitrarily other than that.
It seems that all iOS users run into this issue, as the BLE stack of iOS does not reveal the mac address if I’ve understood correctly.
Maybe we should send unique ID of the tags in data in the future?
This will cause some serious headache in the future with our upcoming iOS mobile app. So, a unique ID should be added. Do we have how many unused bytes available? Also, TX power & button pressed & NFC triggered would be nice to have… @ojousima @io53
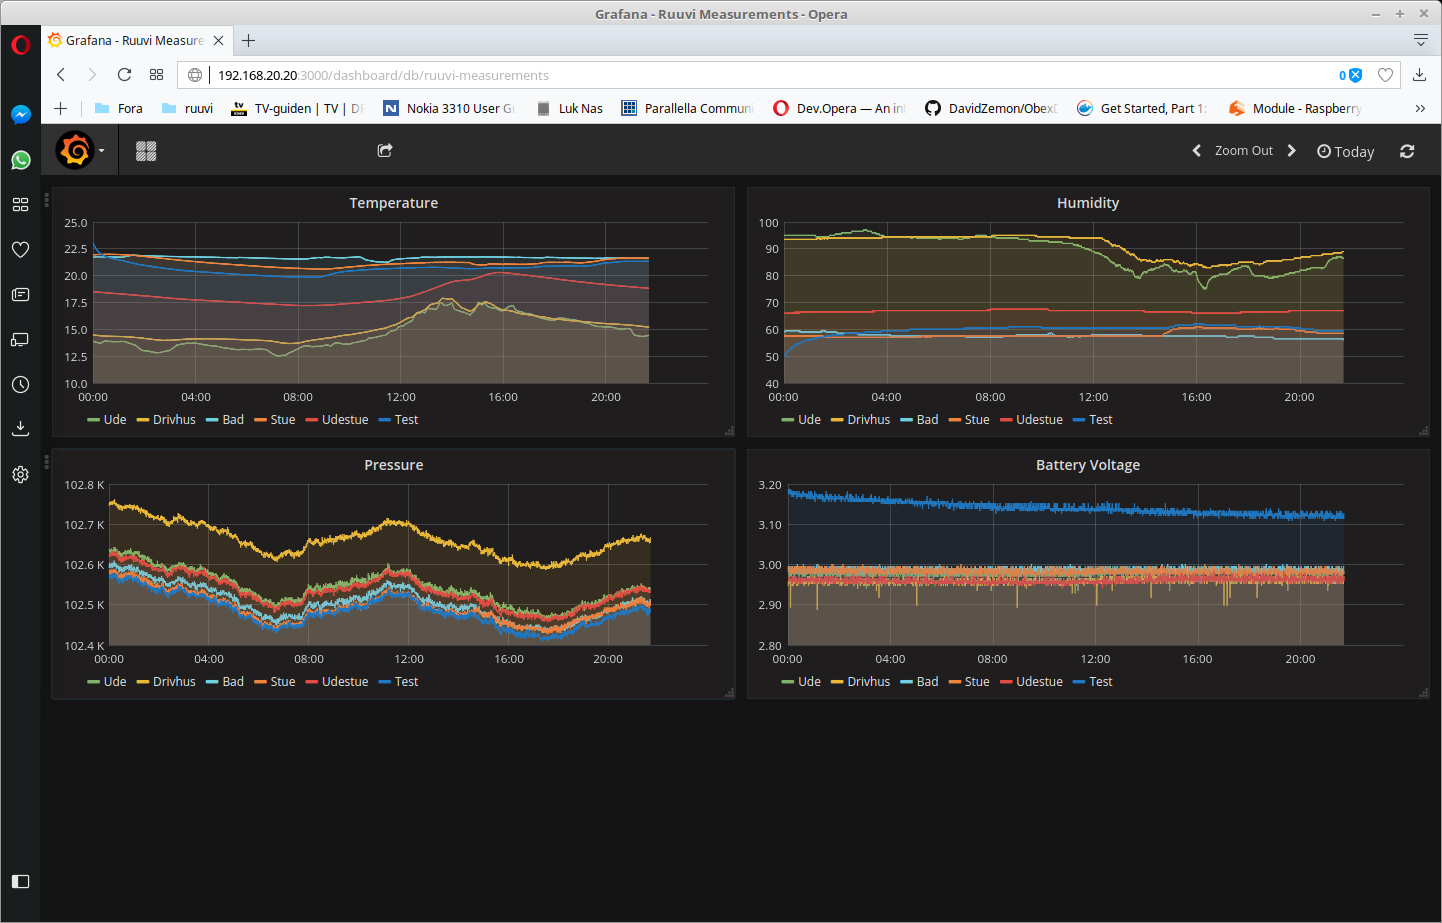
It seems that the pressure is inversely proportional to the battery voltage.
The highest voltage corresponds to the lowest pressure.
My Ruuvi tags are set up at different times, the latest yesterday (Test).
That is an interesting discovery. Are all tags at the same height, i.e on a table next to each other? Even slight change in height causes a difference in measured pressure.
If yes, I’ll check the results while adjusting voltage to RuuviTag
Ude at 1.7 meters.
Drivhus, Bad, Stue, Udestue and Test at ca. 1.0 meters.
Stue and Test on same table next to each other.
@anon24749318 That’s interesting and maybe we’ll consult Bosch after confirmed with more units. However, they promise ±0.12hPa relative accuracy (at steady 3.3V) so probably inside the specs anyways…
https://www.bosch-sensortec.com/bst/products/all_products/bme280
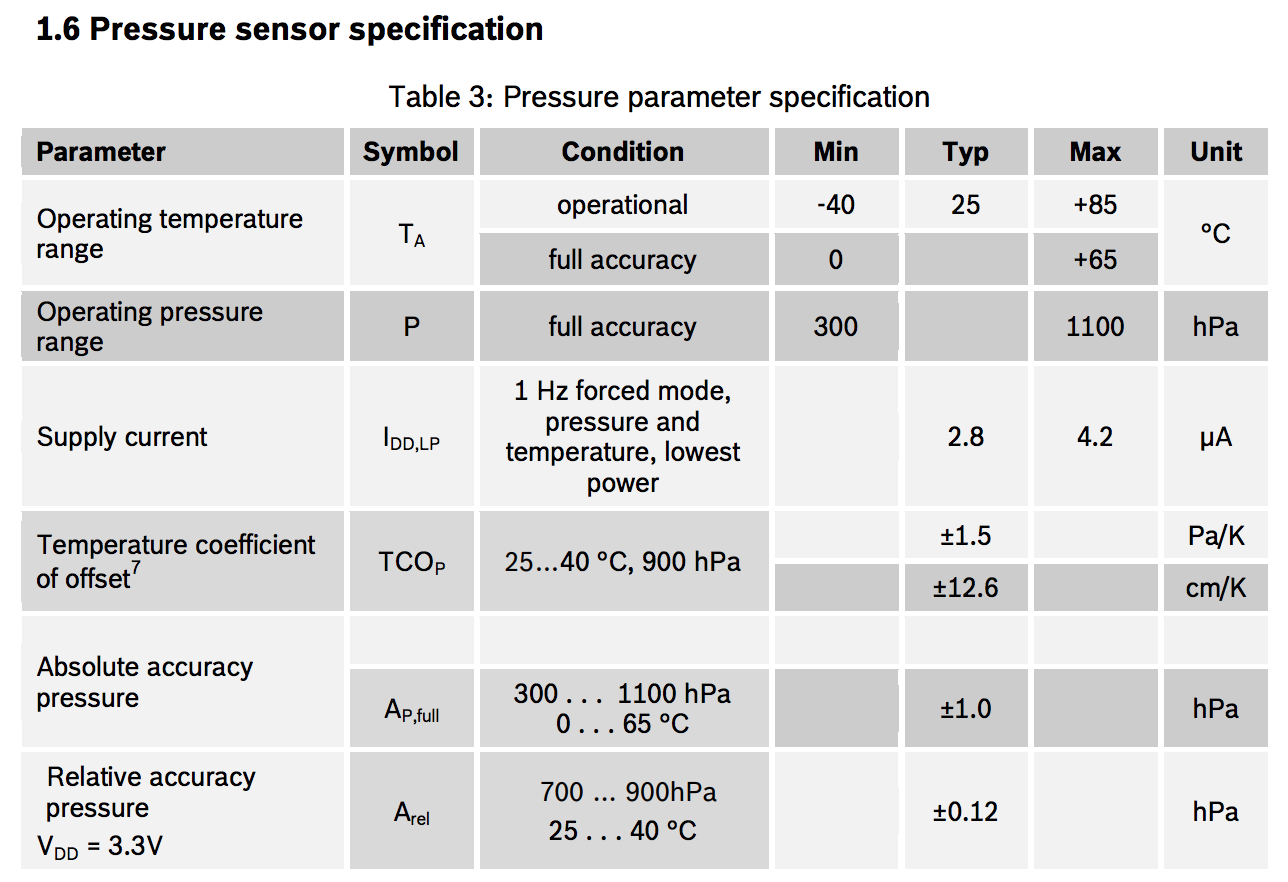
I think it’s the Absolute accuracy we’re interested in when comparing tag-to-tag rather than a relative change measured on a tag (which is rel. accuracy). Abs. accuracy should be +/- 1 hPa it seems, the biggest difference in the graph seems to be around 1.8 hPa, substracting the accuracy from that gives 0.8hPa which would translate to roughly 6-7 meters of altitude difference depending on the temperature and other things… Technically if one tag would be off by -1 hPa and the other by +1 hPa it would still be within the specs… 
It’s also worth noting that things like mechanical ventilation in a building make a significant difference too, at same altitude I get a ~1.5 hPa difference in pressure between indoors and outdoors when the ventilation is at the 2nd lowest setting
I understood @anon24749318 was talking about relative differences (changes) between tags “Stue” and “Test”… ![]()
Thanks for your reply otso, sorry for taking so long to respond.
I was able to figure out Influx commands, although the epoch timestamps did confuse me at first. As far as I can tell when the graphs stop Influx also stops recording data.
I couldn’t find anyway to diagnose why this might be happening though, I’d be grateful for suggestions.
Assuming I understood correctly, we are talking about comparing a measurement by tag “Stue” to a measurement by tag “Test” at the same time.
If so, when comparing one sensor to another sensor, it’s the absolute accuracy that matters. Basically, the absolute accuracy means the accuracy when observing the absolute value, for example “the current atmospheric pressure is 1025 hPa”. Relative accuracy means the accuracy when observing the relative pressure differences experienced by one individual, for example “the pressure is now 2.5 hPa more than what this sensor measured two minutes ago”, without taking into account what the absolute value is or was.
Basically the absolute value (where the absolute accuracy matters) is the measured absolute value at a given point in time, the relative value is when you compare one measurement at a given point in time to another measurement at another point in time by the same individual sensor.
For a practical example, imagine an old style analog thermometer with the thin glass tube filled with a colored liquid with lines and numbers painted next to it, it’s easy to cause a relatively large error margin in the absolute measurement if you poke the glass tube up or down, causing the apparent height of the liquid change place (along with the entire glass tube), but even then, the relative accuracy is not affected by it, because you can still see that the apparent measurement has increased, say, two degrees since one hour ago, irrelevant from whether it changed from +6 to +8 or +11 to +13. And thus, when you compare this one thermometer to another individual unit, the absolute (in)accuracy of both units make a difference, because you are comparing the absolute value of both units.
I have gathered all 6 ruuvi on a table and will leave them for a couple of days.
Then I will take a new picture of Grafana.
It might be that you’re running the collection on SSH shell, so when you disconnect the collecting process stops. If you’re running the collector as a service or in screen there’s some other issue.