I wanted to have a quick demo of a RuuviTag dashboard that I could install on any Linux computer, and I didn’t find one that was easy to install, so I created this myself:
With a simple docker-compose up -d you fire up seven Docker containers:
-
bt-mqtt-gateway: Reads RuuviTag sensor measurements using Bluetooth Low Energy and forwards them to a MQTT broker. I have added RuuviTag support to this project.
It hasn’t been merged yet, so for now this is the Docker container of my own fork. - HiveMQ MQTT Web Client: Connects to Mosquitto and shows you the MQTT messages in your web browser using WebSockets.
- Mosquitto: Receives the MQTT messages from bt-mqtt-gateway and relays them to anyone who is interested.
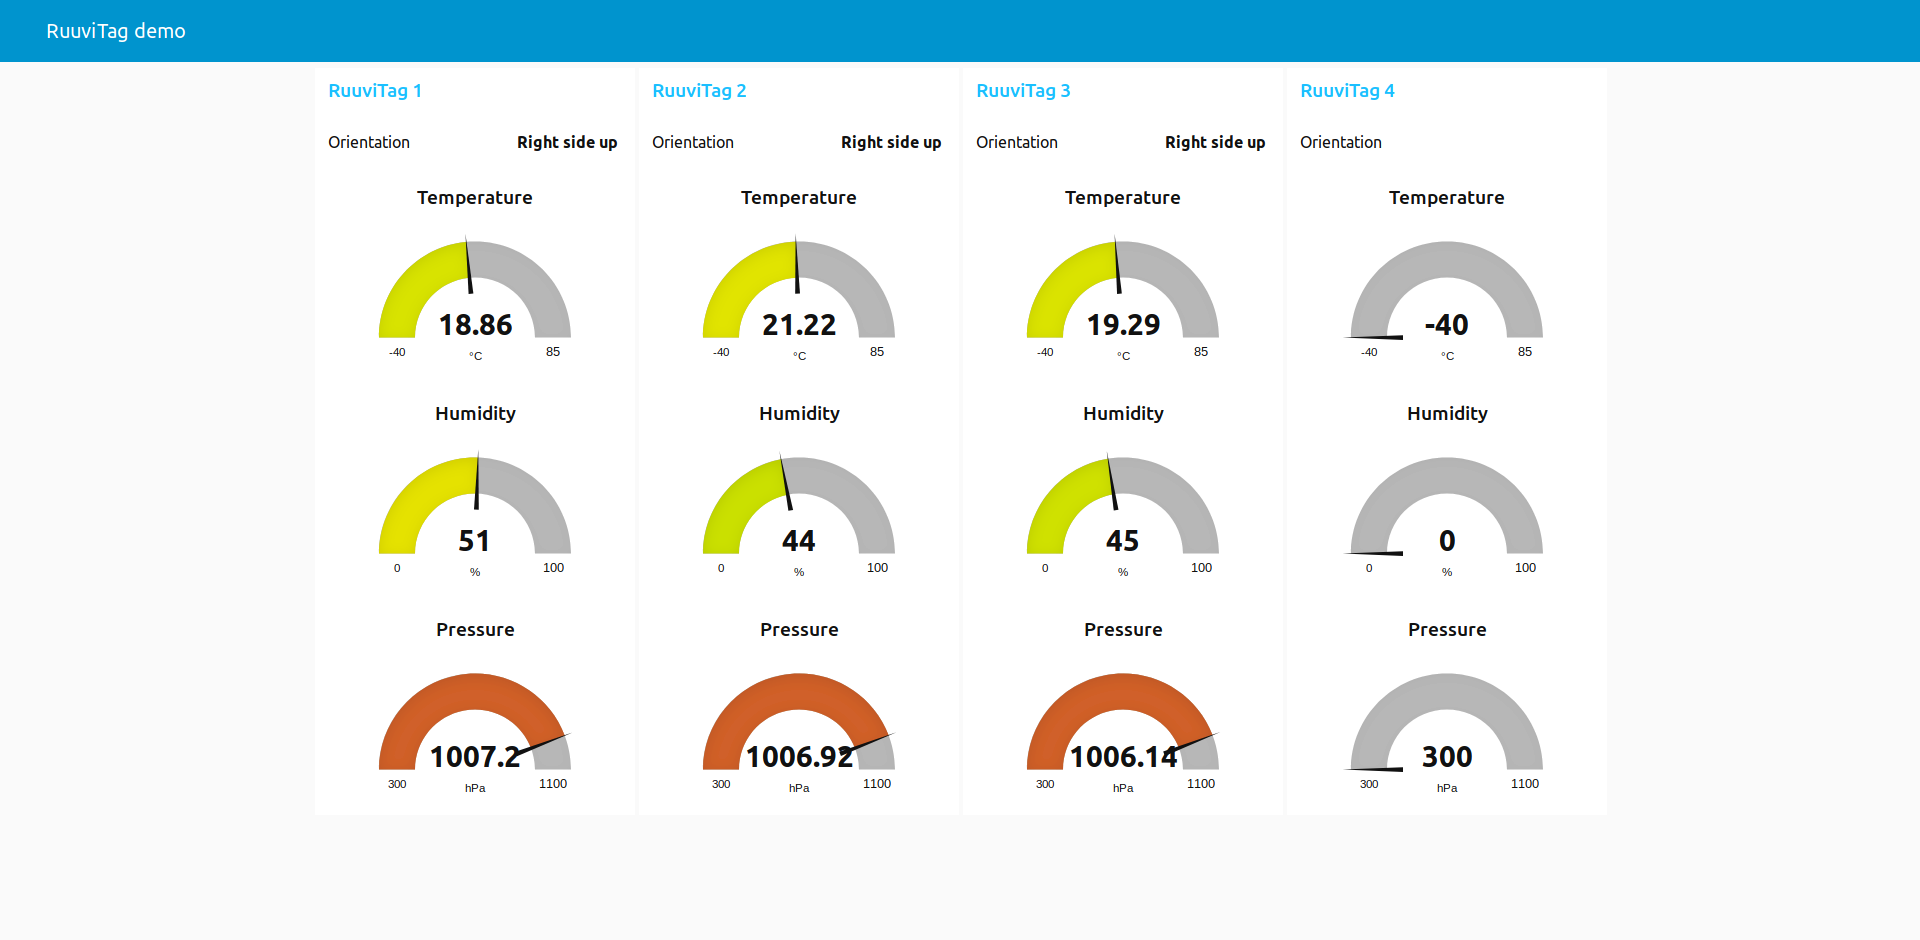
- Node-RED: Subscribes to the MQTT messages from Mosquitto and shows the values in a dashboard.
- Telegraf: Collects MQTT messages from Mosquitto and sends the values to InfluxDB.
- InfluxDB: Stores all the values of the RuuviTag measurements in a time-series database.
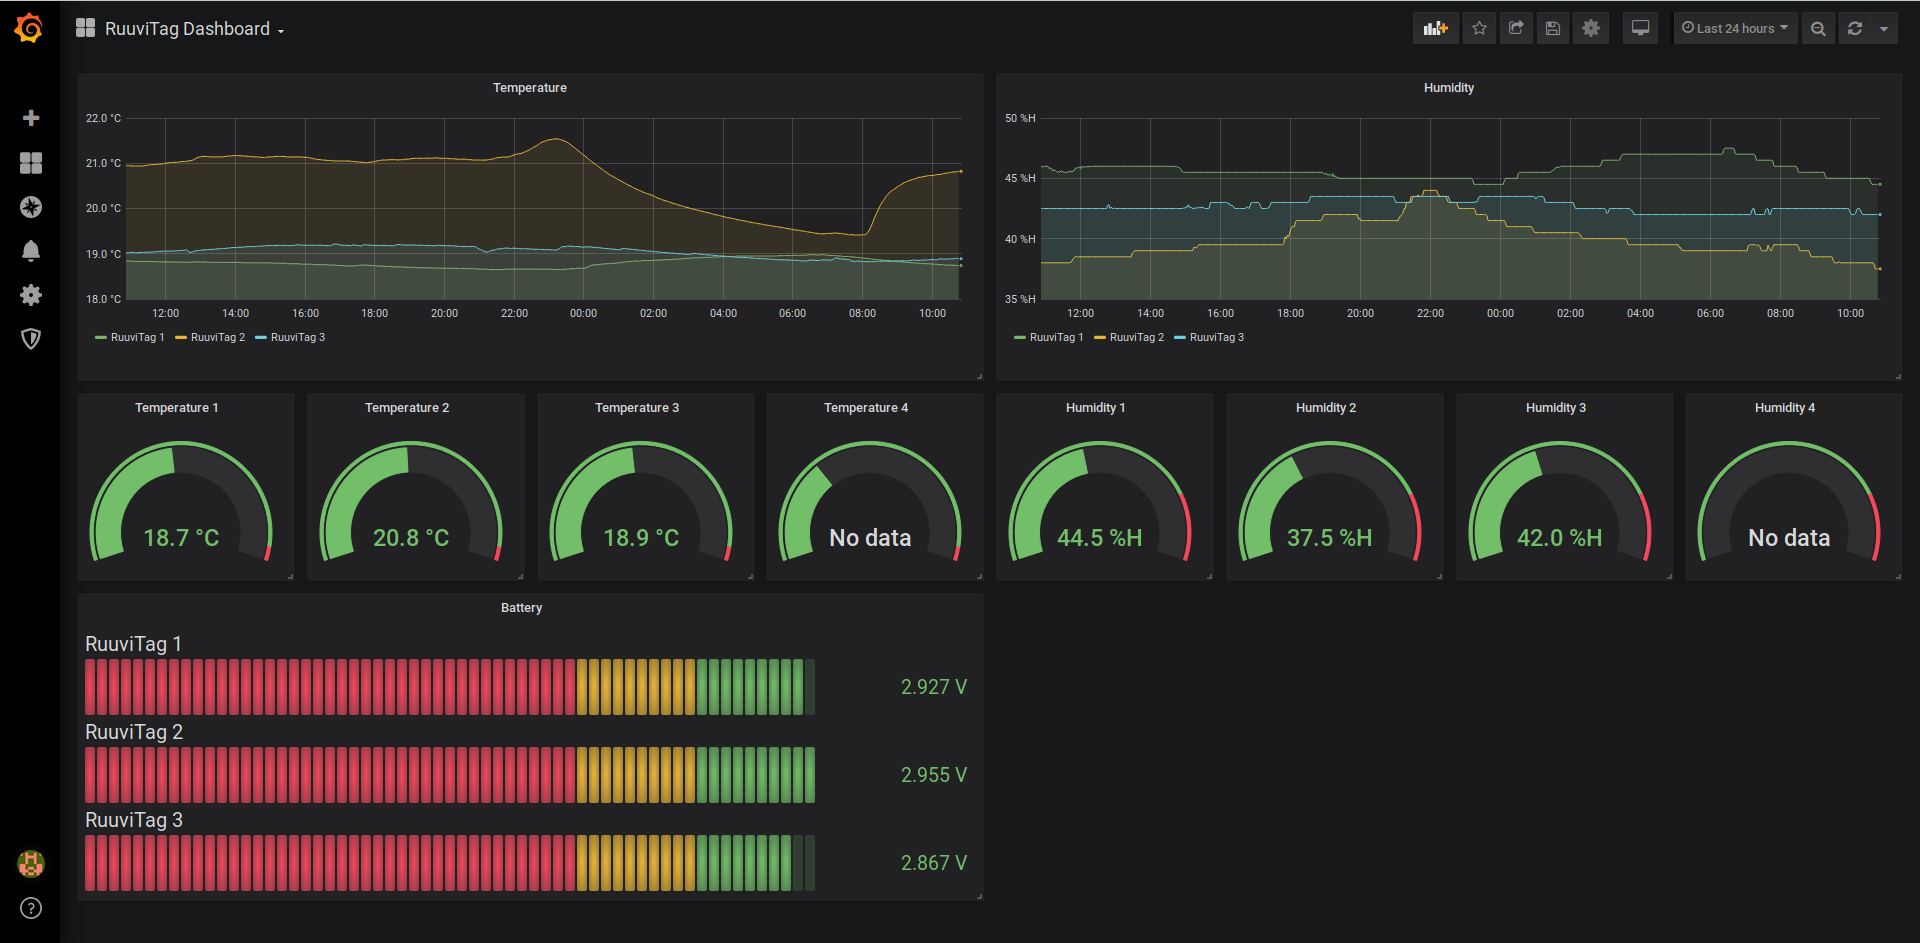
- Grafana: Shows the values of the InfluxDB database in a dashboard.
You have access to:
- The MQTT web client on http://localhost:8080
- The Node-RED flow on http://localhost:1880
- The Node-RED dashboard on http://localhost:1880/ui
- The Grafana dashboard on http://localhost:3000
The Node-RED and Grafana dashboards are basic, and pre-configured for three RuuviTags. You can change the dashboards at will.
Note that this is purely a demo of how you can process RuuviTag sensor measurements and feed them to MQTT, a database and dashboards, so there’s no security such as encryption and authentication. Only use this demo for evaluation purposes.