I got Ruuviberry working on my Raspberry Pi 3 but I am having trouble configuring Grafana to detect and monitor my three beacons properly. Is there a step-by-step guide for “dummies” available??
Also, I was wondering what version of Raspbian Ruuviberry is based on…Wheezy or Jessie???
Thanks in Advance…
Have you already explored this topic?
Here are also some details:
Hello Mikael,
Start grafana: sudo systemctl enable grafana
Point your browser to your grafana installation, e.g. http://ruuvi.local or http://IP_ADDRESS:3000
Edit the mac values in grafana dashboards
EDIT: New image runs on http://raspberrypi.local or http://IP_ADDRESS, i.e. on port 80. Therefore there is no need to add :3000 anymore to URL
Hi, you need to sign in (admin/admin, please change)
[image]
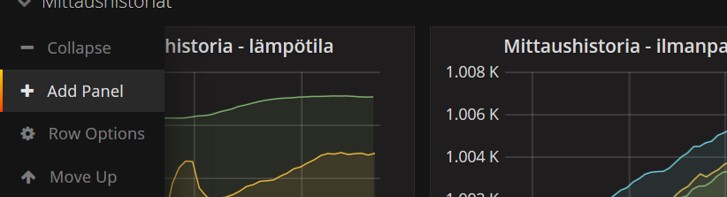
Click on frame of the panel and then “edit”
[image]
Open a measurement window and change mac address. You’ll have “known” mac addresses in dropdown menu.
Or can you describe, how the tags are not recognized properly?
The tags are recognized but how do I configure it for temperature, humidity, etc…
If you have defined the Grafana as described the topics above, you should get the tags to the graphs as follows:
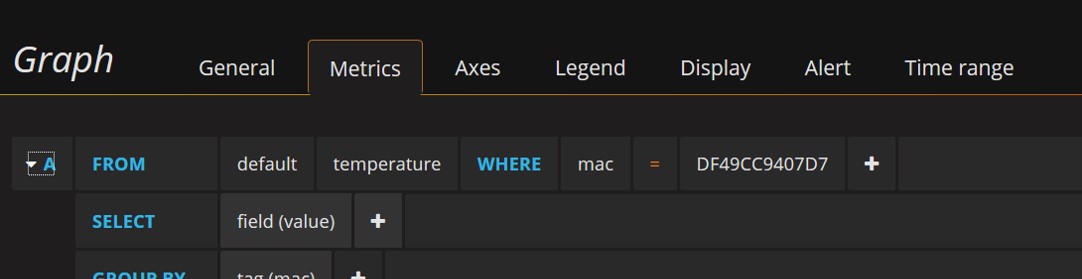
Go to your Grafana dashboard and click ”Add Panel” on the left side of the window.
Choose Graph for the type of the panel.
Click the panel header and choose Edit.
Go to the ”Metrics”-tab and choose the query as described below. The ”Select Measurement”-field defines temperature, humidity, pressure…
If you would like to have another tag in the same graph, just add a new query clicking ”Add query” -button on the bottom of the Metrics-page.
Hopefully this helps you going forward with your project.
1 Like
Ok, I downloaded the JSON files and I got them imported into Grafana successfully…Now how to change the temperature measurement format to Fahrenheit from Celcius…