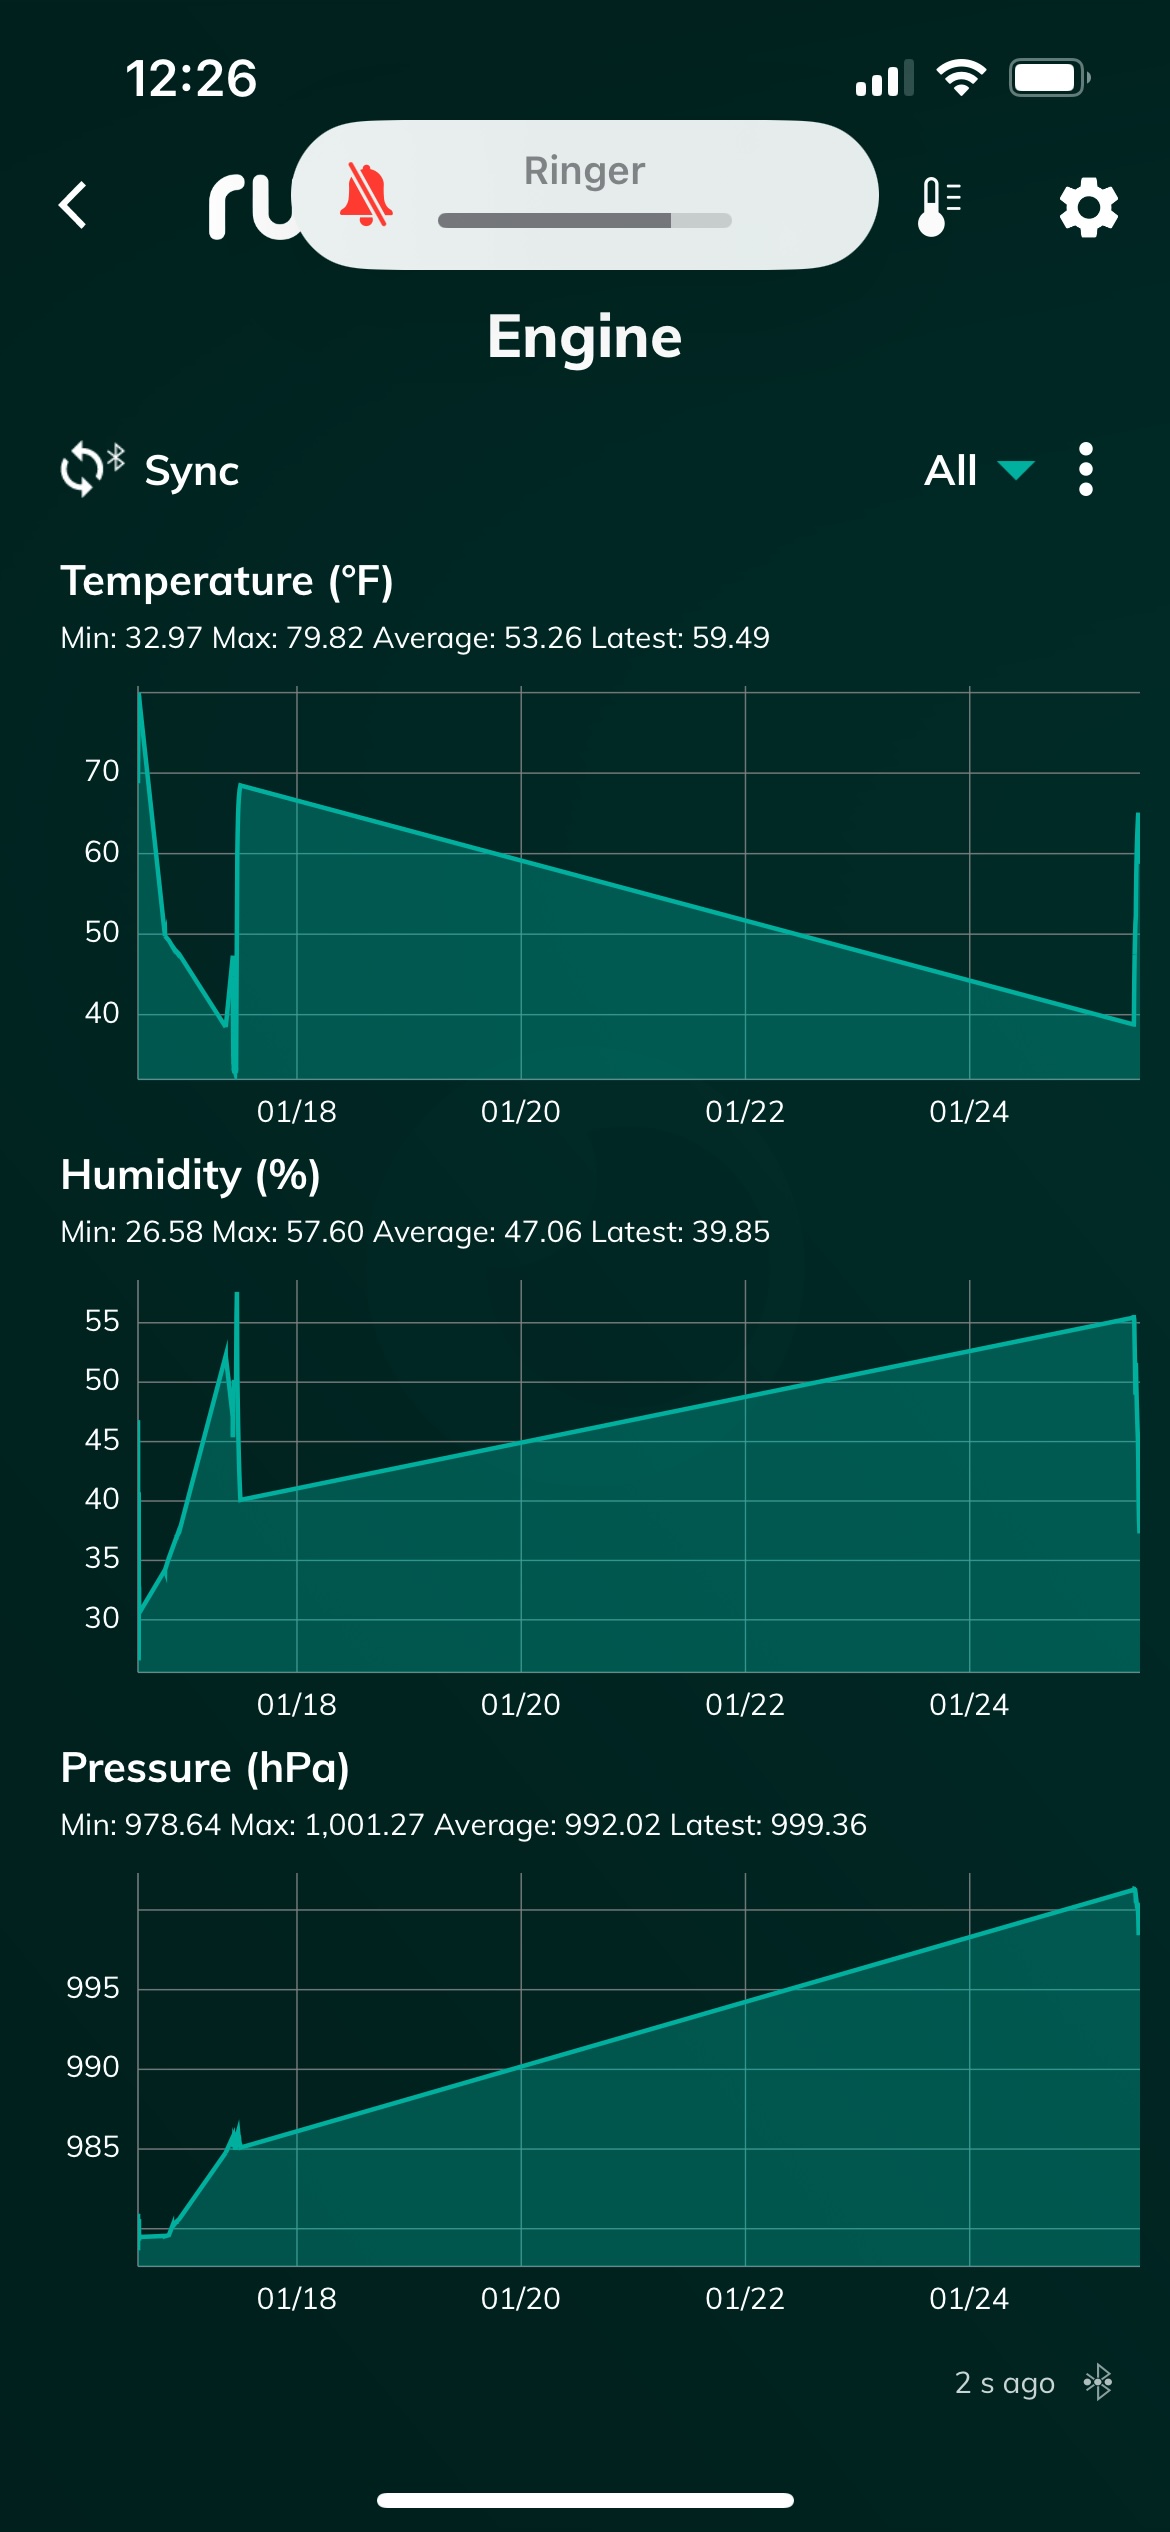
Does anyone have any idea why the graphs look like this?
My thinking is there should be some diurnal cycle showing. The sensor was left on top of a wooden shelf in a compartment in my boat. The compartment should feel the effects of 45 degree water on one side, and 15 degree to 45 degree air via other compartments on the other sides.
The data does not look real except at the beginning and end when I had it in my hand.
Thanks for your message. It looks like there are no datapoints recorded to Ruuvi Station from this sensor in between these dates for an unknown reason, possibly sensor being out of Bluetooth range or unpowered.
You can confirm this by going to three dots menu and making CSV or XLXS -export.
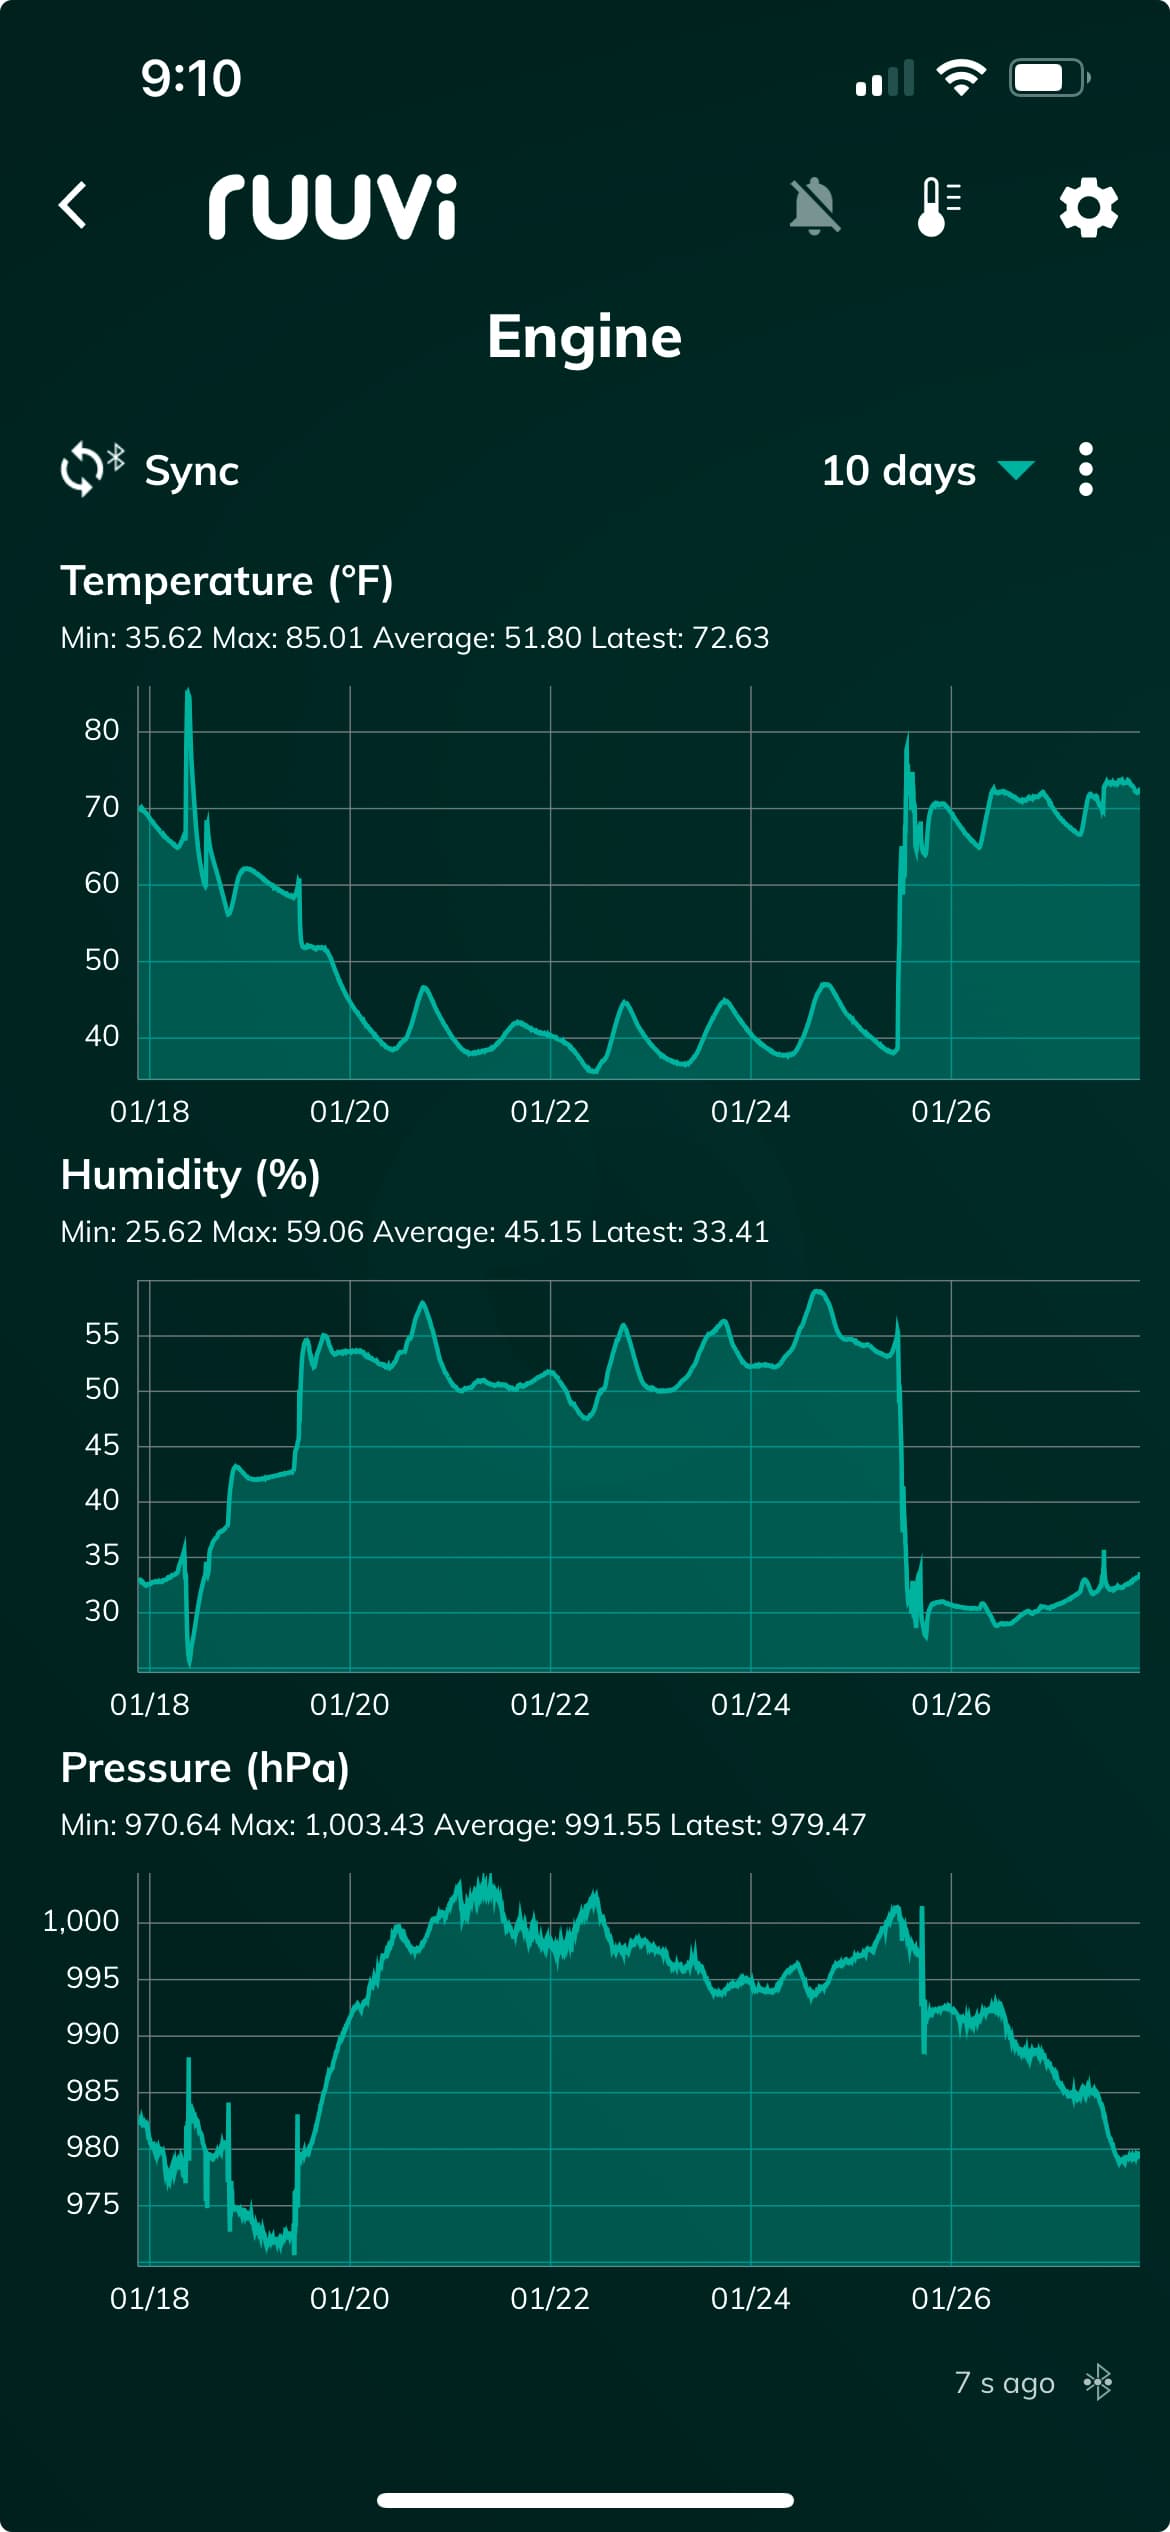
Hello @yelkenli . Your Ruuvi sensor will record measurement history to it’s internal memory independently with 5 minutes interval. If RuuviTag was powered with battery during this time, you can download the measurement history from the sensor internal memory to Ruuvi Station mobile app on history view page by using the Sync button.
In order to perform the sync, you will need to be close to your Ruuvi sensor, as the history will be downloaded using your mobile device Bluetooth connection, then go to History view page and tap on Sync button to start the process.
Hi @Marko, is there a way to have this Bluetooth sync’d data transfer to the web station app as well?
I have a sensor that is on the edge of the range limit for my gateway station, so I end up with a lot of these “No Readings” straight lines on the temperature graph.
Is it possible to sync with bluetooth and push those recordings to the web app to keep those graphs up to date as well?
Thanks.
Hi @Charles , in short, there are technical limitations related to this and we don’t support syncing measurement data from mobile app to the Cloud service.