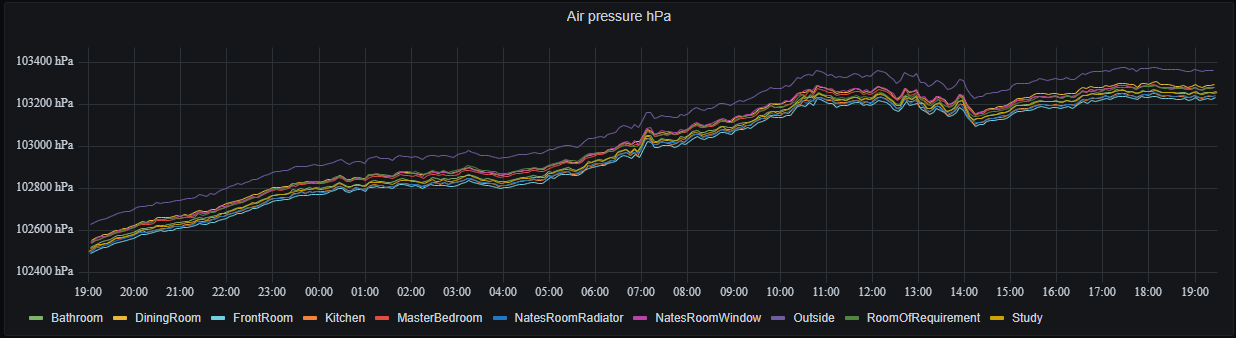
A volcano (Hunga Tonga-Hunga Ha’apai) erupted in Tonga last week on Saturday. There have been reports of a measurable pressure wave across the world. I, too, was able to see the effect with my RuuviTag
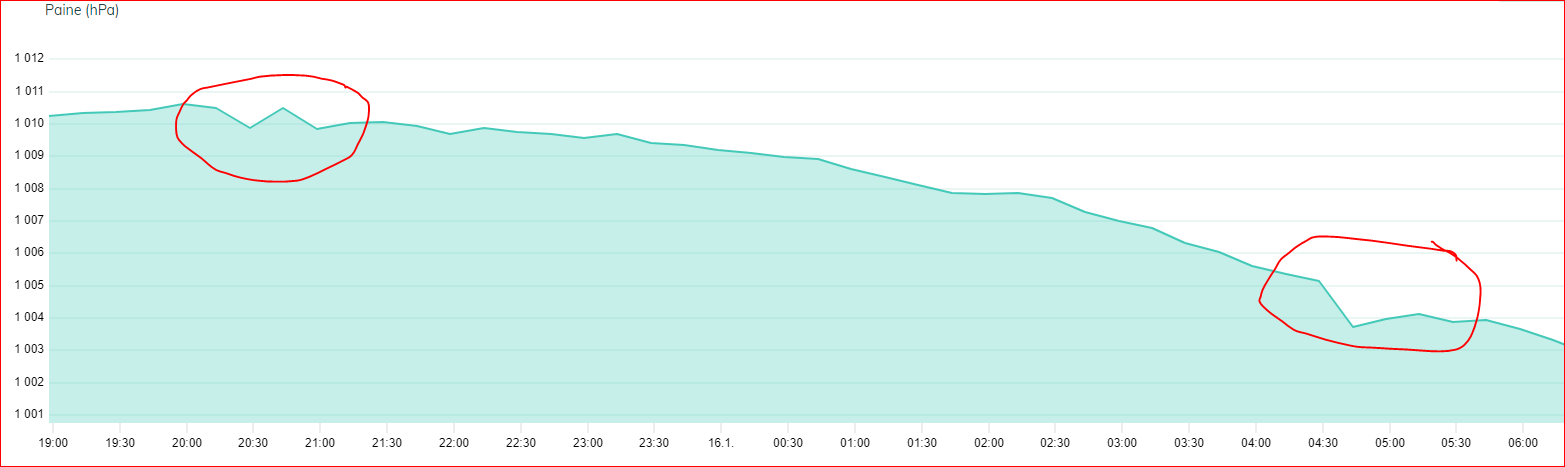
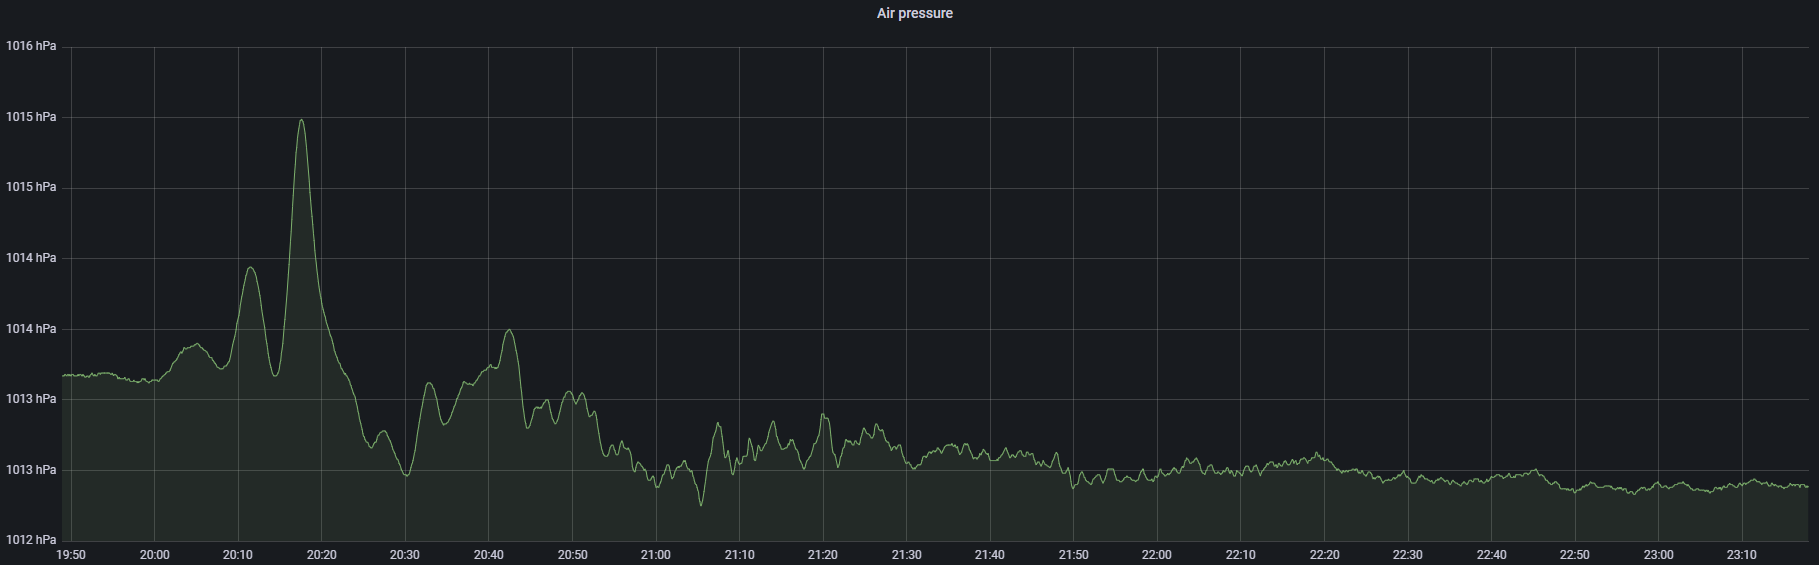
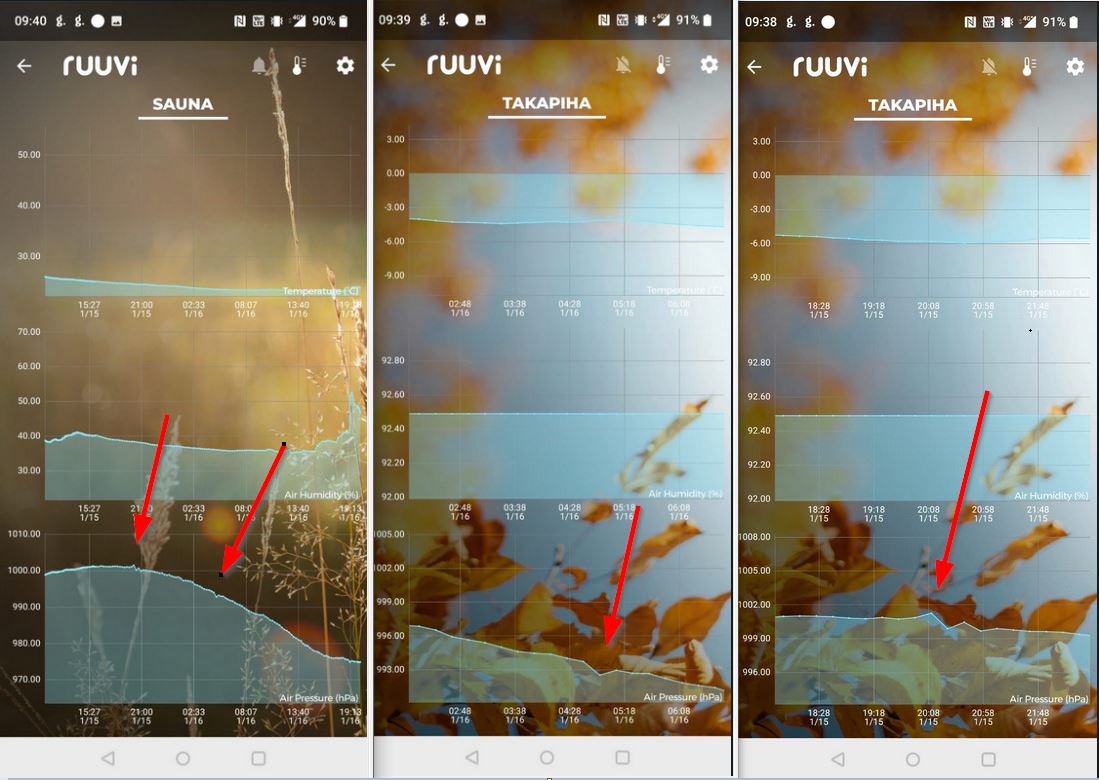
Increase on Jan 15 at 20:30
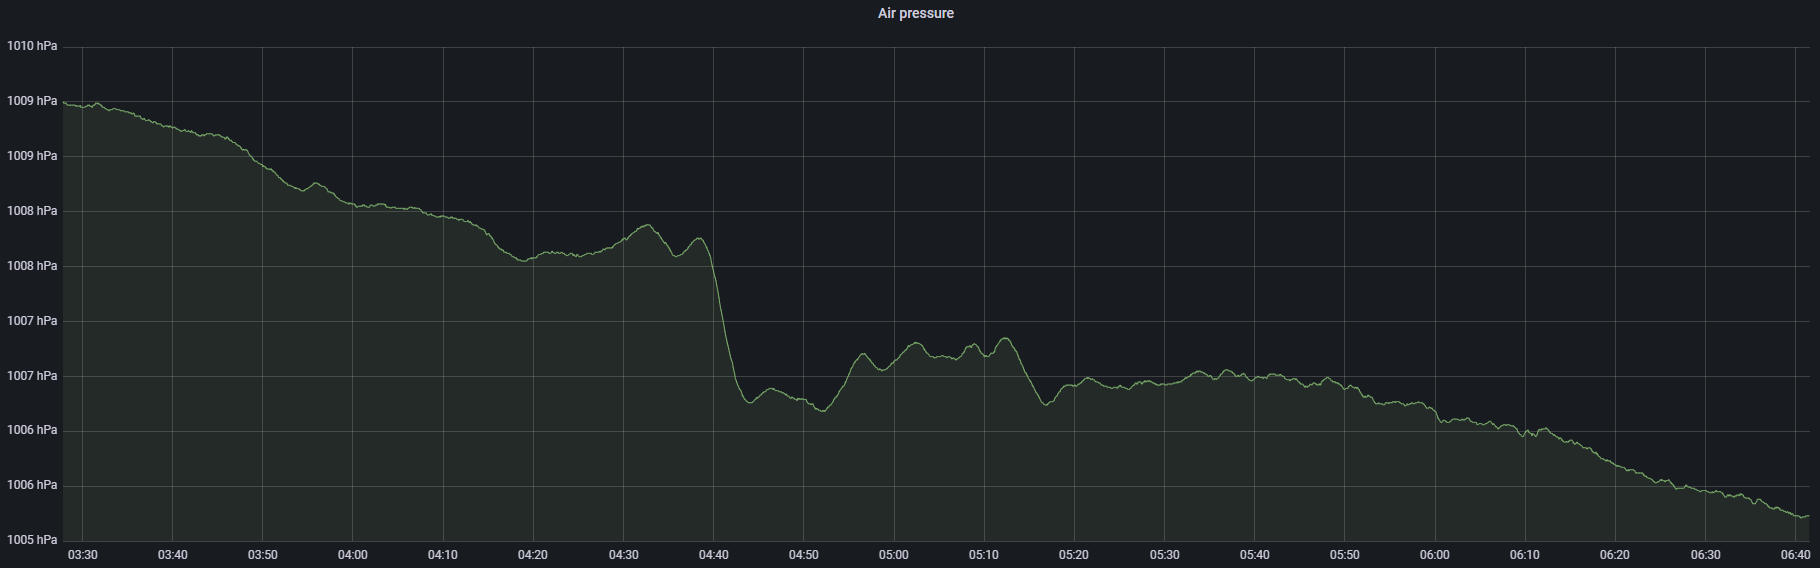
Decrease on Jan 16 at 04:30
The change is not huge, and it is more visible in the App which collects measurements more frequently. All of my RuuviTags have the increase and decrease.
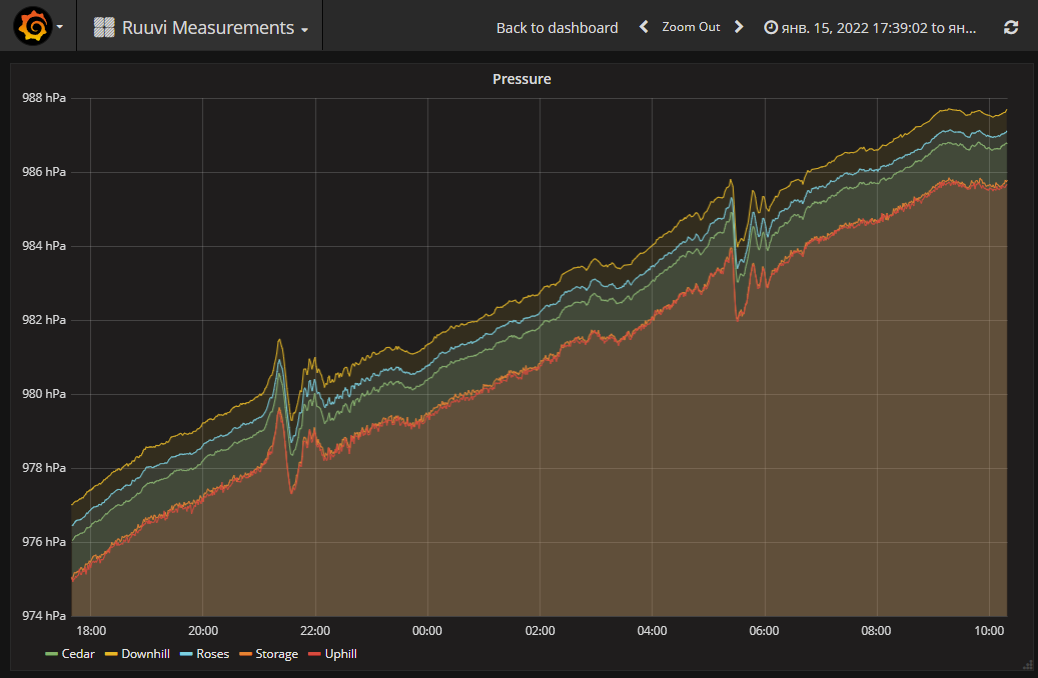
To me the most interesting detail is how the air pressure has all these tiny ripples long after the wave, while being relatively calm and stable before the wave.
Thanks for the 5-second graphs. I thought I’d get the same when syncing the RuuviTag with the App but it was just the 5-minute graphs. Maybe I misremembered how it was supposed to work.
Anyways, as I wrote, this was a wow moment! Thanks, Ruuvi, for making it so easy!
PS. I did not look at the acceleration data. Probably nothing registered
I found nothing in my acceleration data when I checked, only noticeable changes were in the pressure measurements (and other measurements that are affected by pressure), as you guessed. Considering the frequency of the first wave observed here was in the millihertz range, it’s very difficult to pick up on anything but a very sensitive pressure sensor
I did not really believe that the RuuviTag’s acceleration data would reveal anything. But I would not have believed in the pressure wave being visible either.
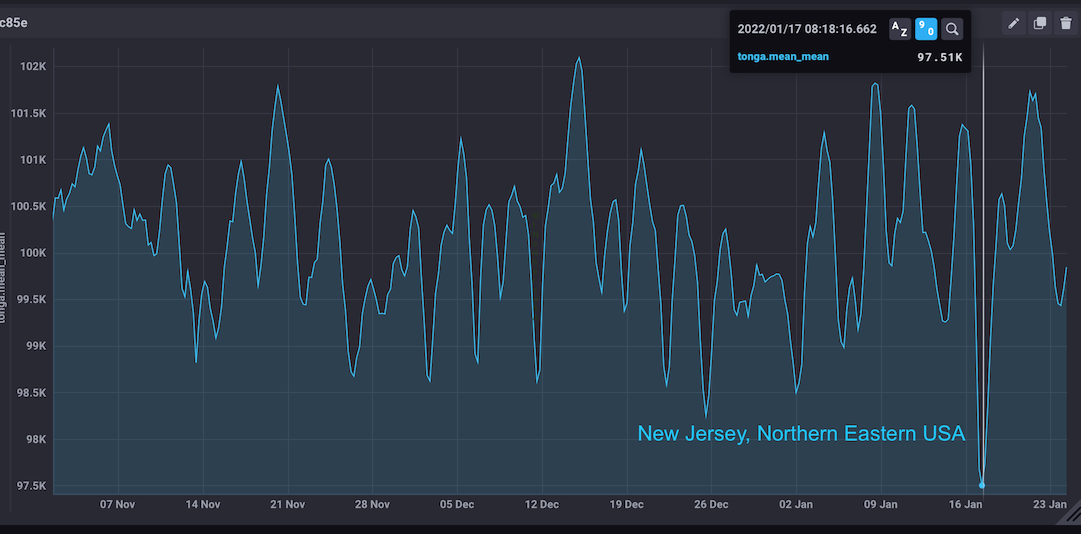
I tried to find subsequent passages of the pressure wave in my RuuviTag pressure data. My calculations showed that
The 2nd passage of the 1st wave would be at 8:30 on Jan 17 in Helsinki, and this I found in the pressure data
The 2nd passage of the 2nd wave would be at 16:50 on Jan 17 in Helsinki, and this I found in the pressure data
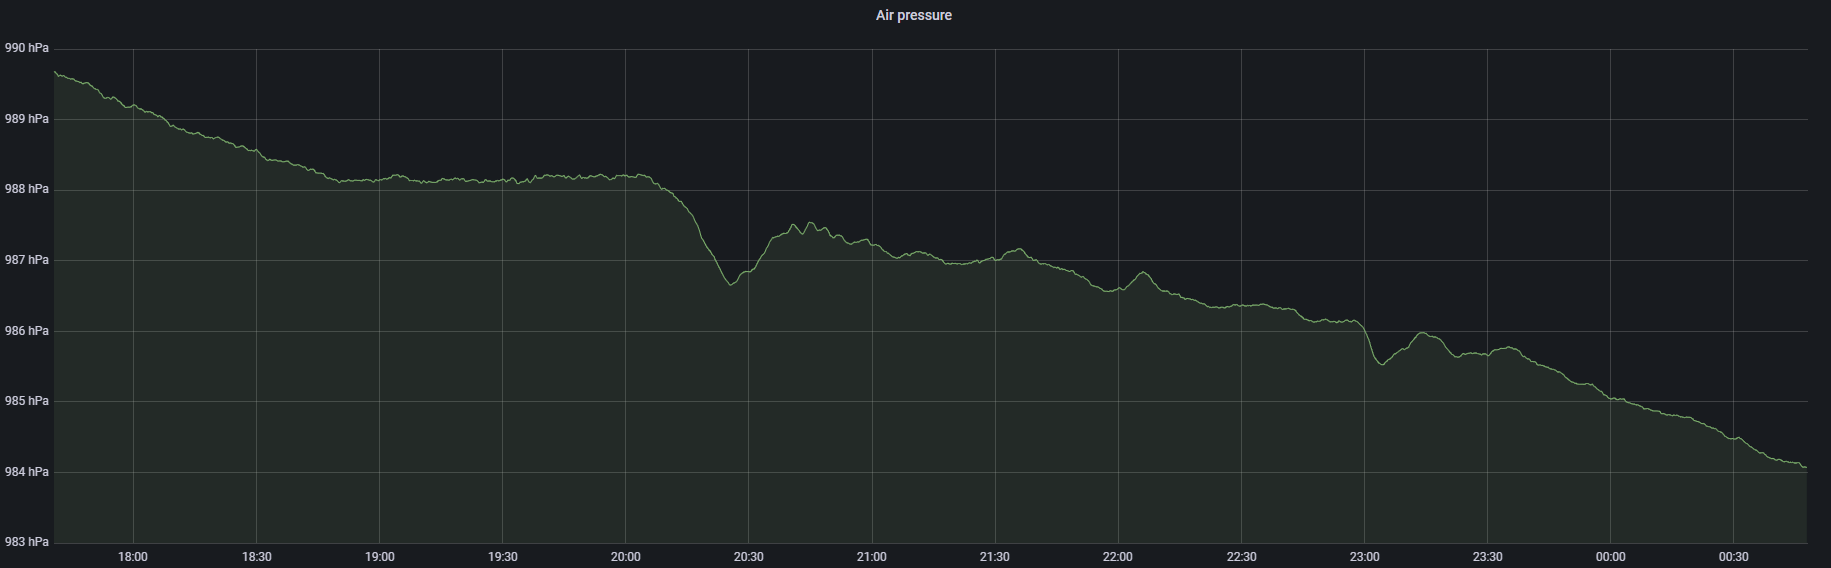
I also found something in the pressure data at 20:40 on Jan 16 but it does not match with the pressure wave going around the Earth. Any thoughts? Some constructive interference of two pressure waves?
Thanks for the graphs. The Jan 16 20:40 event was in Helsinki, EET (GMT + 2).
I do not have my Excel in which I calculated the distances and speeds in front of me right now but I believe this event corresponded to a distance of 40 000 km from the moment main eruption, at the speed of sound. It made me wonder how that could have been linked to the main eruption. Maybe it was from a secondary eruption.