While collecting data from Ruuvis with RuuviCollector I have some tags which are reporting temperatures which are slightly changing all the time. Is this normal? Are there any tips to make the graph look “smoother”?
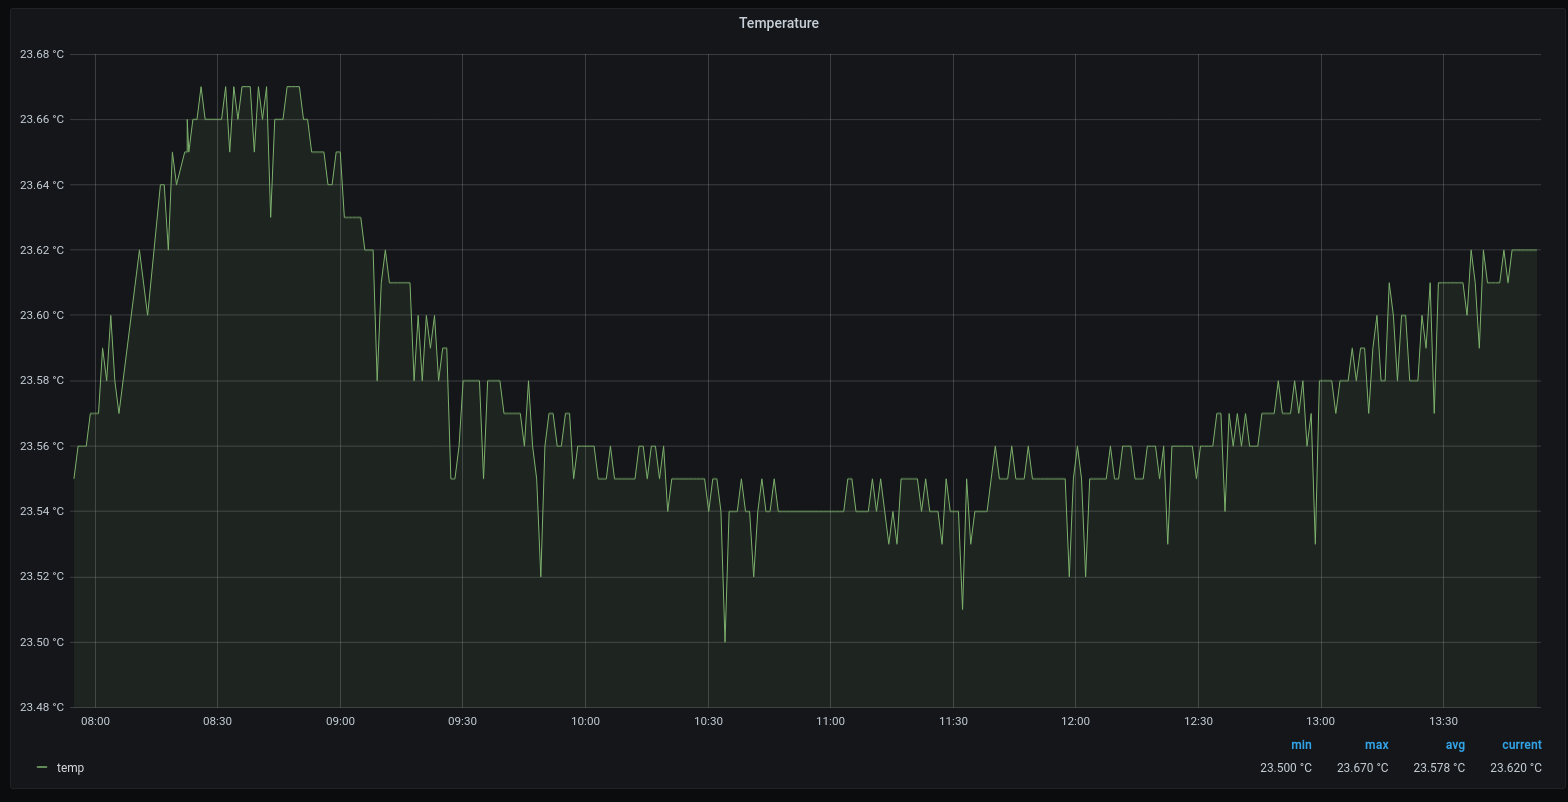
The spikiness here is caused by the small scale on Y-axis which makes 0.01 C changes look big. You could configure to have a fixed Y-axis to have larger coverage, or you could use some mean over time graphing.
You can add a moving average transformation (in the panel edit view, on the SELECT row, add Transformations -> moving_average and experiment with the sample count for it to find the best balance between smoothness and response; larger values average over a larger set of samples which makes the graph smoother, but it will make graph respond to rapid changes “more slowly”.