When I access the ruuvi station it nicely list all the new tags (data format 5) and shows the data, sometimes its shows some of the older tags (data format 4), It’s also lists strange MAC addresses?!. All tags with data are nicely shown in the cloud dashboard. Why don’t older tags show up? This API history request is a great thing and would make own local data logging easy,
Hi @Mike ,
It’s highly recommended to update older sensor firmware to latest. If you have version 2.5.9 or earlier it’s already quite old. Current stable is 3.31.1.
Yes, I know but the sensors are in concrete so now way to upgrade (have only external power, not the upgrade button😮💨). The great thing is that the ruuvi station supports these old versions also. Therefore would be nice if they would show up also in the history API request.
Hello Mike,
Do you mean the Ruuvi Gateway /history page or Ruuvi Cloud API with a custom code? Can you share the request you’re making so we can replicate this on our side?
1 Like
@Alexey Can you take a look? This is about tags without Ruuvi’s manufacturer specific data not showing up properly in /history API endpoint.
1 Like
If needed I could probably arrange VPN access to my station
1 Like
Any update on this issue?
Hi @Mike ,
When you perform “/history” API request, it is processed by your local “Ruuvi Gateway” and you can see all sensors there (new and old, data format 5 and 4), right?
It’s also lists strange MAC addresses?!. All tags with data are nicely shown in the cloud dashboard. Why don’t older tags show up?
Could you clarify what do you mean? Are you not seeing data from your old sensors on your cloud dashboard? Or do you have sensors that transmit data in a format other than dataFormat 4 or 5? What do you mean by “strange MAC addresses”?
You attached one screenshot, but with valid data (dataFormat 5). Could you attach screenshot with an example of “bad” data that is not shown in the cloud dashboard? Or just attach full output of “/history” and mark the sensors that you expected to see in the cloud, but don’t see them.
Hi @Alexey
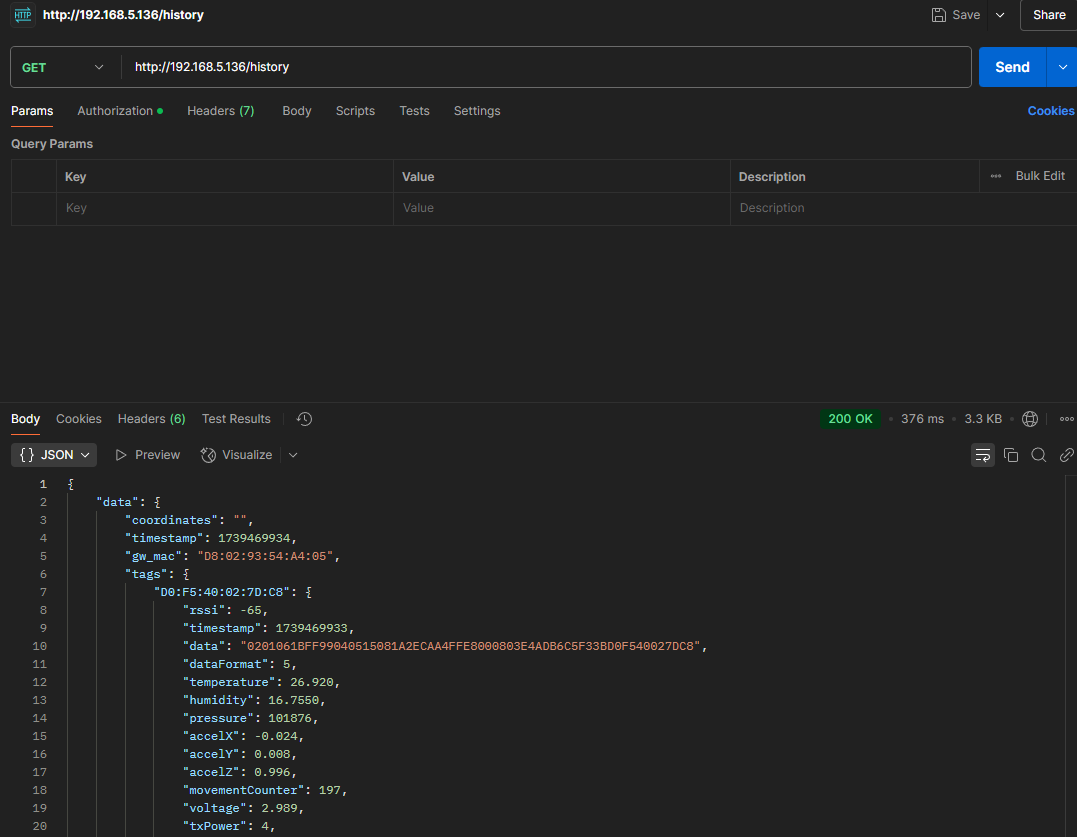
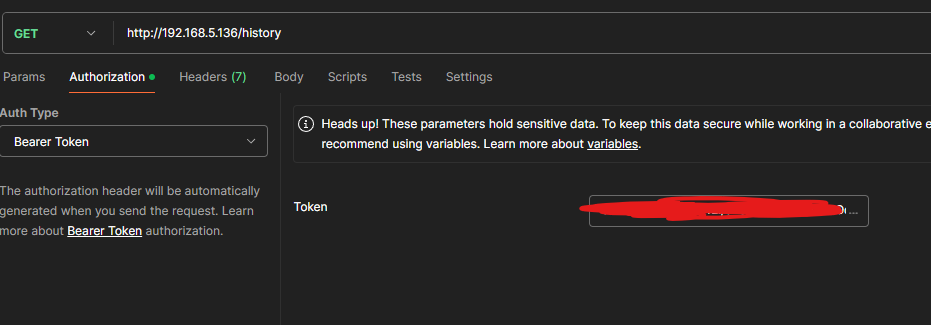
sorry for the delay in answering here is a request I just did through Postman
postman.pdf (62.1 KB)
br
mike.
Hi @Mike,
Here is an excerpt from your pdf with the non-decoded data (all entries except the first):
      "EC:17:CC:62:28:A2": {
        "rssi": -83,
        "timestamp": 1741027269,
        "data": "0201061BFF99040512082A0AC1D1FFC0FFE403D8ADB60D71A7EC17CC6228A2",
        "dataFormat": 5,
        "temperature": 23.08,
        "humidity": 26.905,
        "pressure": 99617,
        "accelX": -0.064,
        "accelY": -0.028,
        "accelZ": 0.984,
        "movementCounter": 13,
        "voltage": 2.989,
        "txPower": 4,
        "measurementSequenceNumber": 29095,
        "id": "EC:17:CC:62:28:A2"
      },
      "E2:BB:18:D5:DE:F2": {
        "rssi": -59,
        "timestamp": 1741027270,
        "data": "0201060303AAFE1716AAFE10F9037275752E76692F2342464154414D46636A"
      },
      "31:D8:65:C5:6D:78": {
        "rssi": -59,
        "timestamp": 1741027256,
        "data": "1EFF060001092022CB16ADE586C47DE271C3916E77D3ABEF6738FD41BDC6EC"
      },
      "45:66:4C:4B:B0:4E": {
        "rssi": -49,
        "timestamp": 1741027229,
        "data": "02011A07030F180A18FFFE11094A616272612045766F6C766532203635"
      },
      "54:31:F2:AA:5D:DE": {
        "rssi": -74,
        "timestamp": 1741027223,
        "data": "02011A020A0C0BFF4C0010063D1ED0036FBE"
      },
      "6F:85:A4:59:91:52": {
        "rssi": -83,
        "timestamp": 1741027219,
        "data": "02011A020A070BFF4C001006111ACF5C9876"
      },
      "07:83:8F:C1:64:67": {
        "rssi": -78,
        "timestamp": 1741027217,
        "data": "1E16F3FE4A17235439454D1132628961A2FFABE50E6ADA3AA1DE7CC5407A01"
      },
      "78:96:A2:C9:0A:A5": {
        "rssi": -83,
        "timestamp": 1741027216,
        "data": "0201021BFF7500021861A1283470415CD624DDF79AF8C73564E3A367EB55FF"
      },
      "57:17:E8:C4:99:36": {
        "rssi": -44,
        "timestamp": 1741027214,
        "data": "02011A07030F180A18FFFE11094A616272612045766F6C766532203635"
      }
As far as I can see, this data is not from RuuviTag sensors. Perhaps you accidentally disabled sensor filtering in the Ruuvi Gateway settings?
Please check that “Listen to Ruuvi sensor only” option is selected on the “Bluetooth scanning” page:
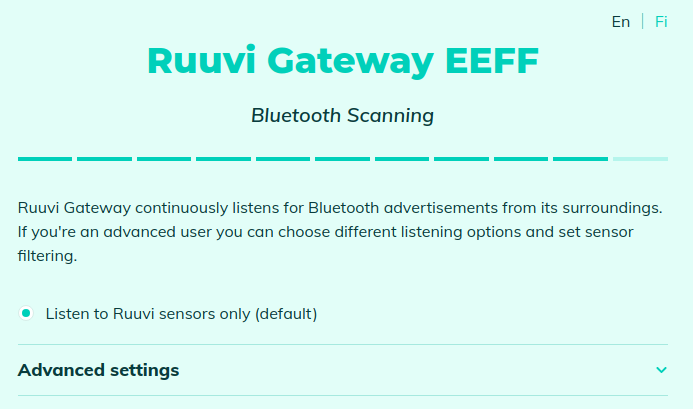
Here is the link to docs: Bluetooth Scanning Settings | docs
In this case Mike has old Google Eddystone Dataformat RuuviTags cast in concrete, it’s not possible to update their firmware and we cannot filter down to Ruuvi Manufacturer Data.
Their data is visible in the /history endpoint, but there’s some non-Ruuvi devices included. I assume the non-Ruuvi devices are the strange MAC addresses.
@Mike How you are trying to view e.g. E2:BB:18:D5:DE:F2? In Ruuvi Station Web app or something else? What is the problem with local data logging?
Hi
now I changed to only listening to ruuvi tags and now the history only lists the following tags when sending the request (With Postman)
D0:F5:40:02:7D:C8
F4:2C:AD:01:66:3C
ED:9C:BF:8A:DD:D8
EC:17:CC:62:28:A2
(one newer tag is missing since run out of battery ![]() EE:D5:5C:A4:13:BD)
EE:D5:5C:A4:13:BD)
It doesn’t list the older tags at all, which is the problem, but they show up very nicely on the web.
I would like to use this request to store the data from the tag. It’s easy to just have a Python program sending this request eq every 60 min and store the result in a MariaDB that I use collecting data for many other sensors than ruuvi tags.
-mike-
The old tags will be missing if you filter to “Listen to Ruuvi sensors only”, because the old firmware looks like Google Eddystone to the Gateway.
The Eddystone URL tags and their data should be in /history if it ends up in Ruuvi Cloud in any case. e.g.
"E2:BB:18:D5:DE:F2": {
        "rssi": -59,
        "timestamp": 1741027270,
        "data": "0201060303AAFE1716AAFE10F9037275752E76692F2342464154414D46636A"
      },
seems like Ruuvi’s Eddystone tag to me