The plot legend on the web page shows the legend and line type for time and for the shown quantity (temperature, pressure…). However, only the quantity is plotted, not the time. I have no idea why time is shown in the legend. An oversight?
Hmm, I don’t fully understand the issue. Could you please share a screenshot? You can also create an issue directly on the repository:
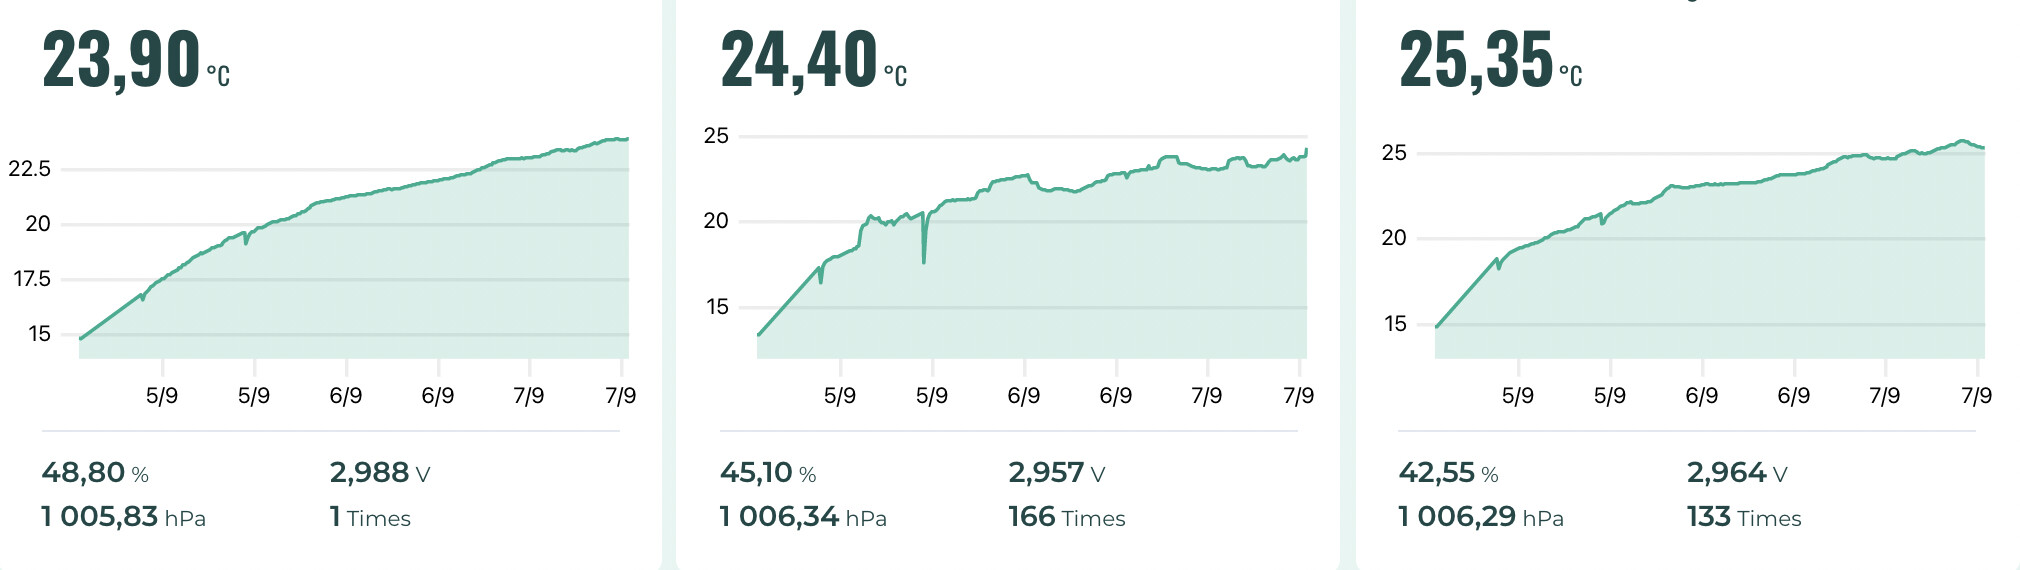
This is how my graphs look like:
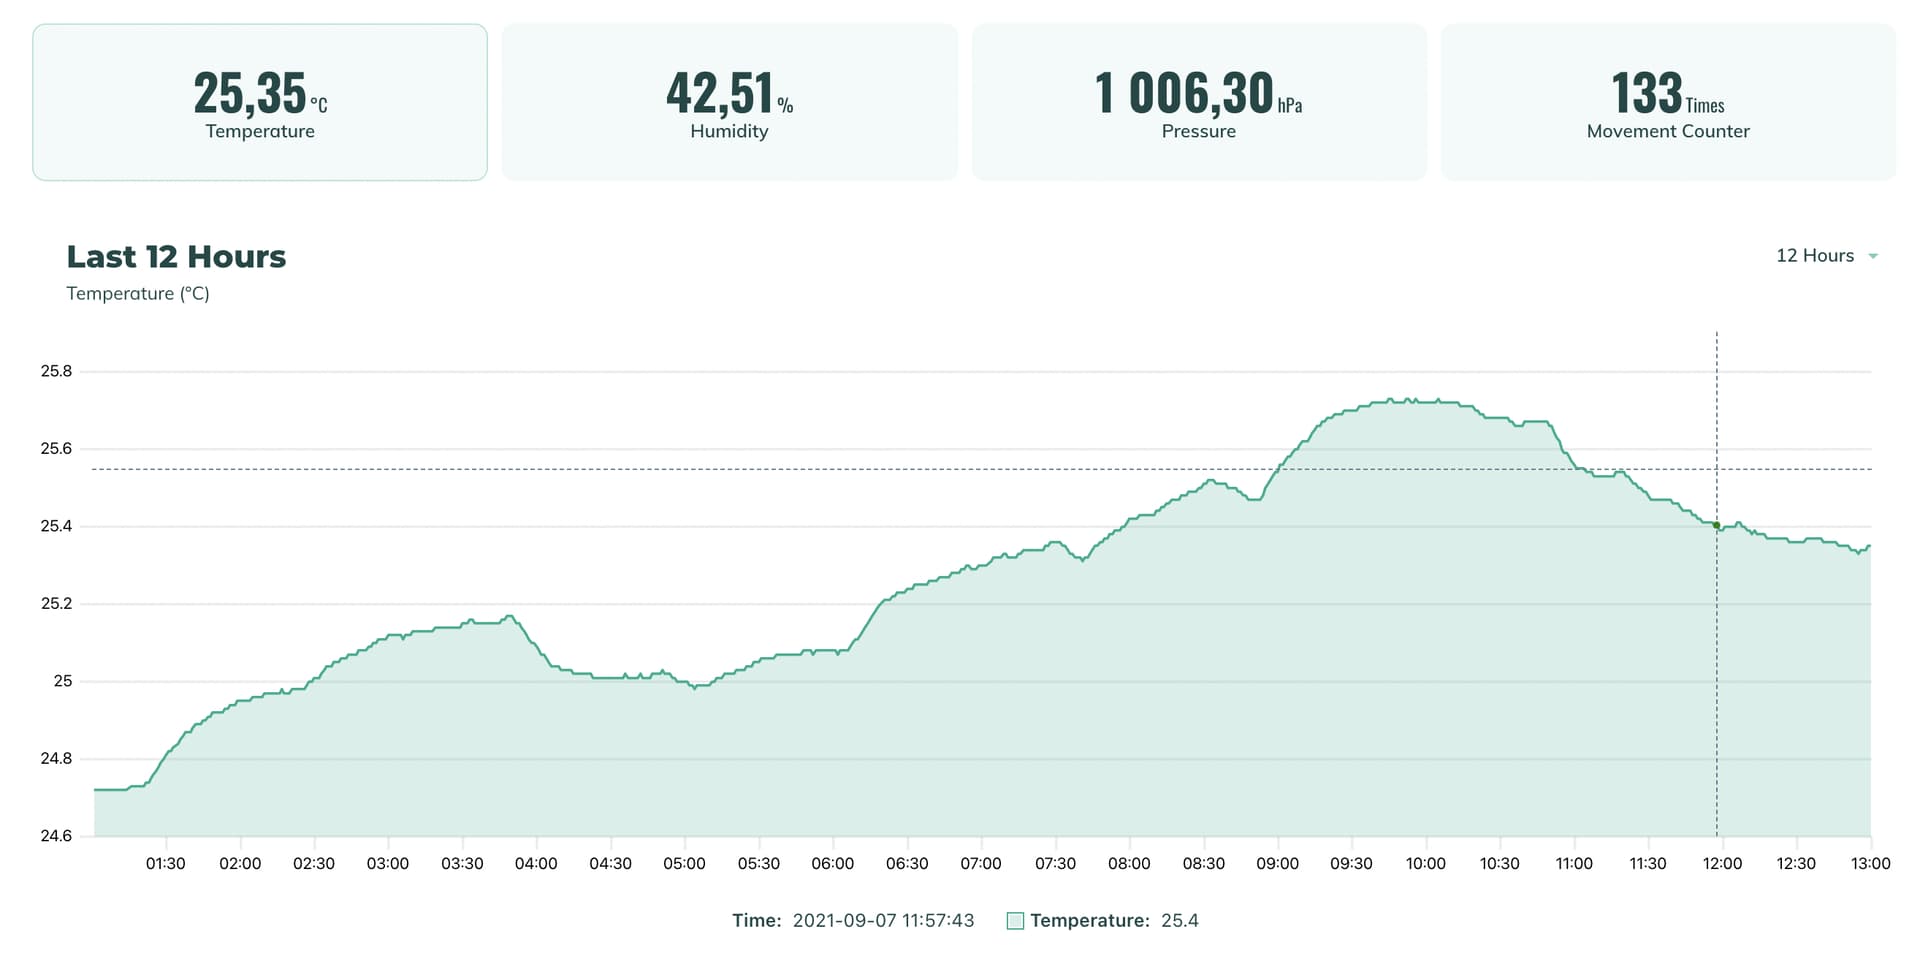
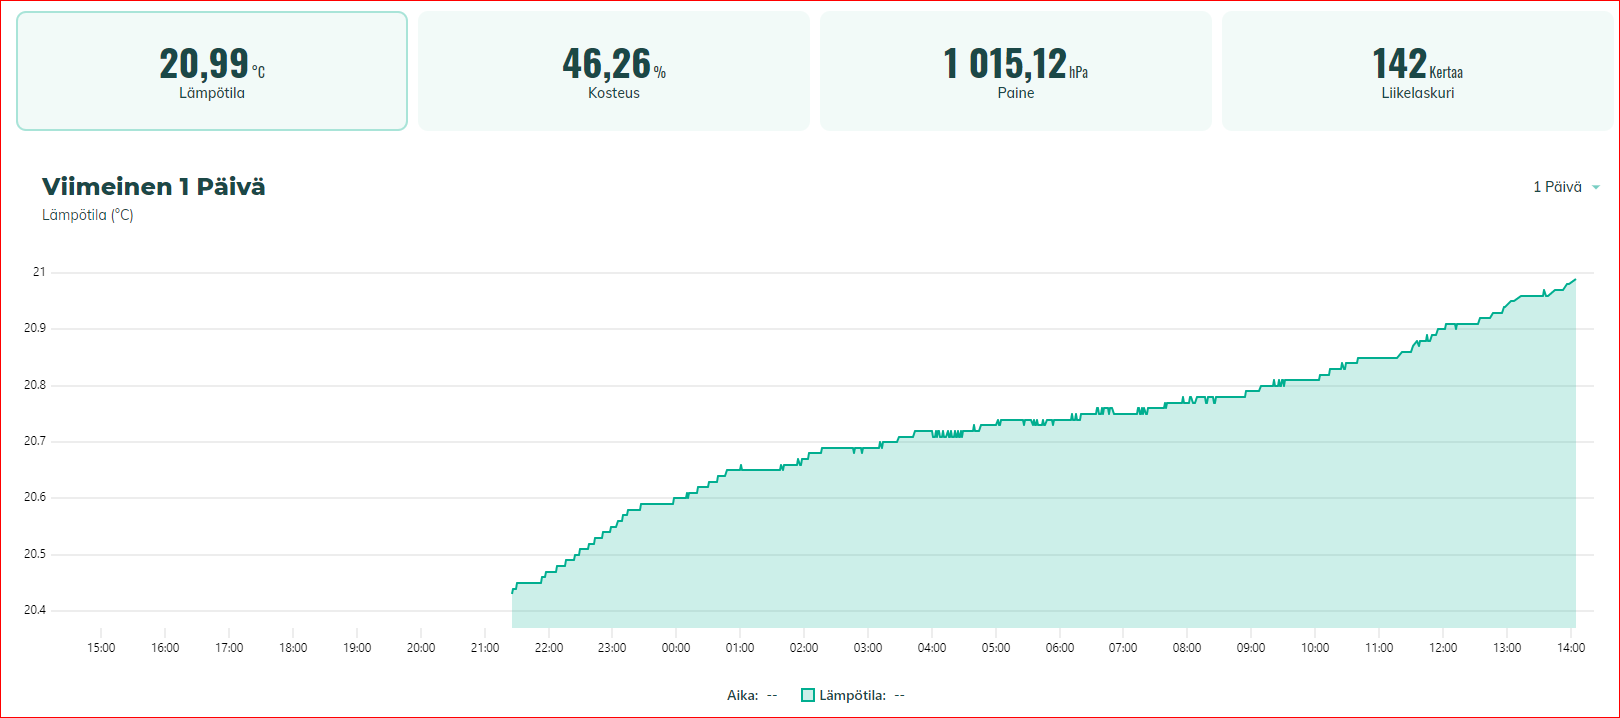
I’ll try with a picture. Based on your screenshot, I realize that the dashes after “Aika” and “Lämpötila” at the bottom of my picture are not to show the line type of the plot, my initial assumption, but to show a value on the graph where the cursor is. So, this was a false alarm. Sorry for that.
1 Like