Yesterday I noticed in station.ruuvi.com that some graphs wrap around in an odd way. It neither happens with all graphs nor with a given graph each time. Actually, it looks quite random to me.
I see the wrap-around graph when I change from one sensor to another using the arrows on the page, but only occasionally. When I move back and forth from the wrap-around graph is usually normal again.
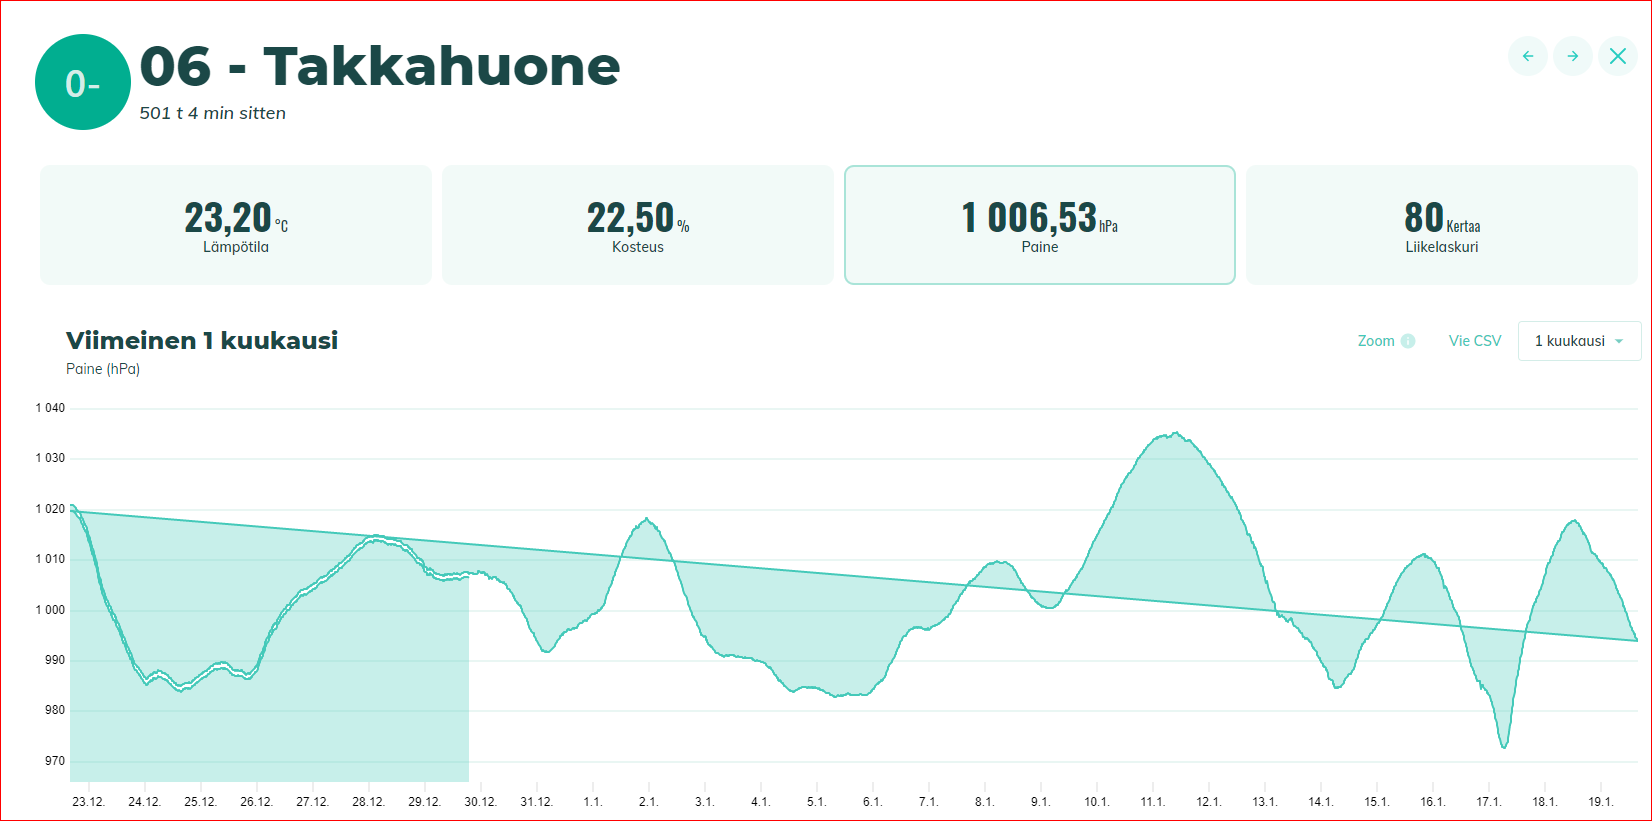
I have attached a picture to show what it looks like. A few thing to note
- I have data from Sep 2021 onwards
- The time of last update looks quite odd, 501 hours. I have a Ruuvi Gateway and the data is updated regularly