Olen hetken aikaa ihmetellyt sisätiloissa olevan kahden Ruuvi Tagin ilmanpainemittauksen eroa. Ero on n. 0,3 - 0,4hPa. Mutta sitten välähti! Nehän ovat eri kerroksissa. Ilmanpaine maanpinnan tasolla muuttuu n. 1hPa / 8m. Näin ollen nuohan näyttävät ihan samaa. Korkeusero on hyvinkin (mittaustarkkuuden rajoissa) tuon n. 2,5 - 3,5m. Tarkkoja ovat…
1 Like
V12 says:
I’ve been wondering for a while about the difference between the two indoor Ruuvi Tag barometric pressure measurements. The difference is approx. 0.3 - 0.4 hPa. But then flashed! They are on different floors. Air pressure at ground level changes approx. 1hPa / 8m. Therefore, they look exactly the same. The difference in height is (within the limits of measurement accuracy) about 2.5 - 3.5 m. The exact ones are…
I have 4 Ruuvi sensors. The sensors have the latest firmware (updated with the Anroid Ruuvi Station app).
Each of the if sensors has a new battery, but some of the sensors are old (5+ years) except for 08D0, purchased a couple of weeks ago.
I implemented a Windows SW to listen for BT Advertisement messages. It plots the readings from the sensors.
The sensors are located in a sealed plastic box. When reading the sensor data, the pressure vary a lot. When all sensor are in same location, there should not be this kind of variation.
My intention is to implement a SW where I can compare indoor/outdoor pressures and pressure changes in a home ventilation unit. By accessing the measurements, I would then be able to adjust the unit.
Is there anything I can do? Or is this normal behavior of the sensor, it can’t do any better.
The ±2 Pa (±0,02 hPa) noise we can see in the graphs looks normal.
Older RuuviTags have Bosch BME280 pressure sensor and the latest ones have Infineon DPS310. Here you can find their datasheets:
bst-bme280-ds002.pdf (1.6 MB)
Infineon-DPS310-DataSheet-v01_02-EN.pdf (749.2 KB)
The noise you asked about is not probably the biggest problem you would need to worry about when trying to sense pressure differences in your ventilation but drifting in different temperatures may be. I personally haven’t tried to use RuuviTags to do this but @ojousima told that he did try and the problem was that when temperature changed outside (but not inside) of the house, the pressure sensor readings started to drift. But maybe if you can control the temperatures, drifting will not be such a major issue.
But depending on your requirements, it is highly possible that RuuviTags are not accurate enough for this use.
ilhe: The graph you have shown only varies 0.1 hPa.
Try drawing the graph at a different baseline and scale.
As with many graphs the baseline can exaggerate or minimize the variation.
I use inHg causes the graph to baseline at 28.5 top of y axis is 30.5. .5 inHg per y axis lines and the graph always looks very smooth.
Lauri: perhaps having the app “round down” the minimum and “round up” the maximum would minimize the variation not only from tag to tag but also over time.
See the graphs at https://mybeacons.info/pressure_inVSmm.html
same data same time period.
in inHg looks smooth but in mmHg looks very variable.
Hi,
I’m finalizing a hobby project designed for balancing ventilation (HVAC) systems. The system is based on comparing pressure data from five sensors: a RuuviAir acts as a reference (located in the room), and four RuuviTags measure pressure in different air ducts.
I have managed to mitigate the thermal drift mentioned by Lauri by using a dual-polynomial calibration (Up/Down curves).
Calibration Logic:
The sensors are calibrated using three anchor points: room temperature, refrigerator, and freezer. Each point is recorded during both falling (Down) and rising (Up) temperatures. Based on these, I calculate second-order polynomials for both directions to produce the final temperature-compensated pressure value. The software also uses a low-pass filter and a trend threshold to determine which polynomial (Up/Down) to apply.
I am currently using older generation RuuviTags equipped with Bosch sensors.
While the software generally works reliably and produces logical results, I’ve encountered two specific challenges:
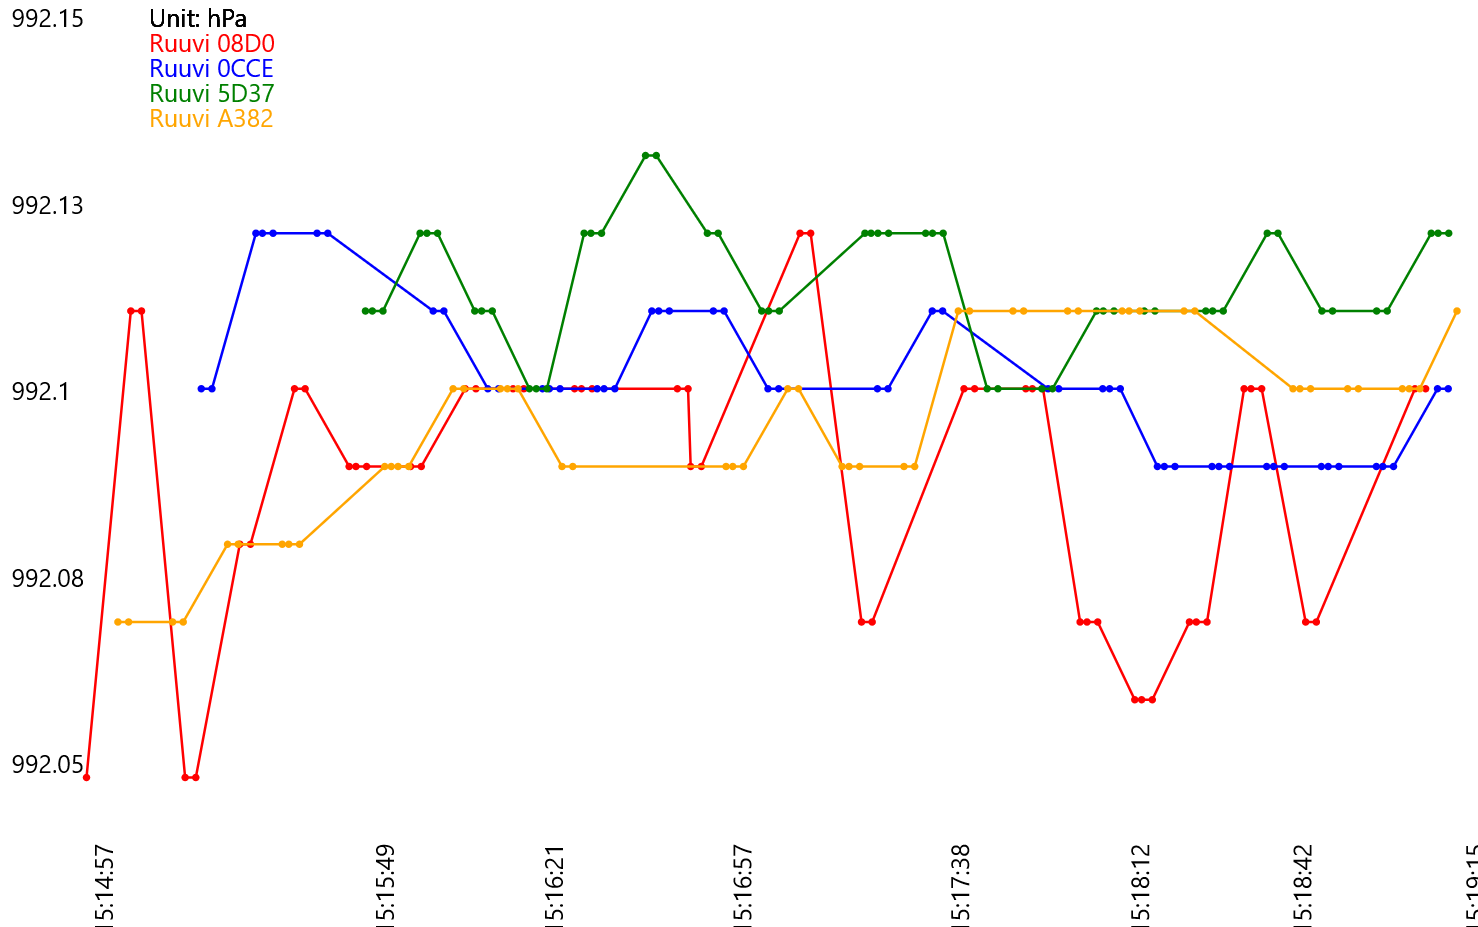
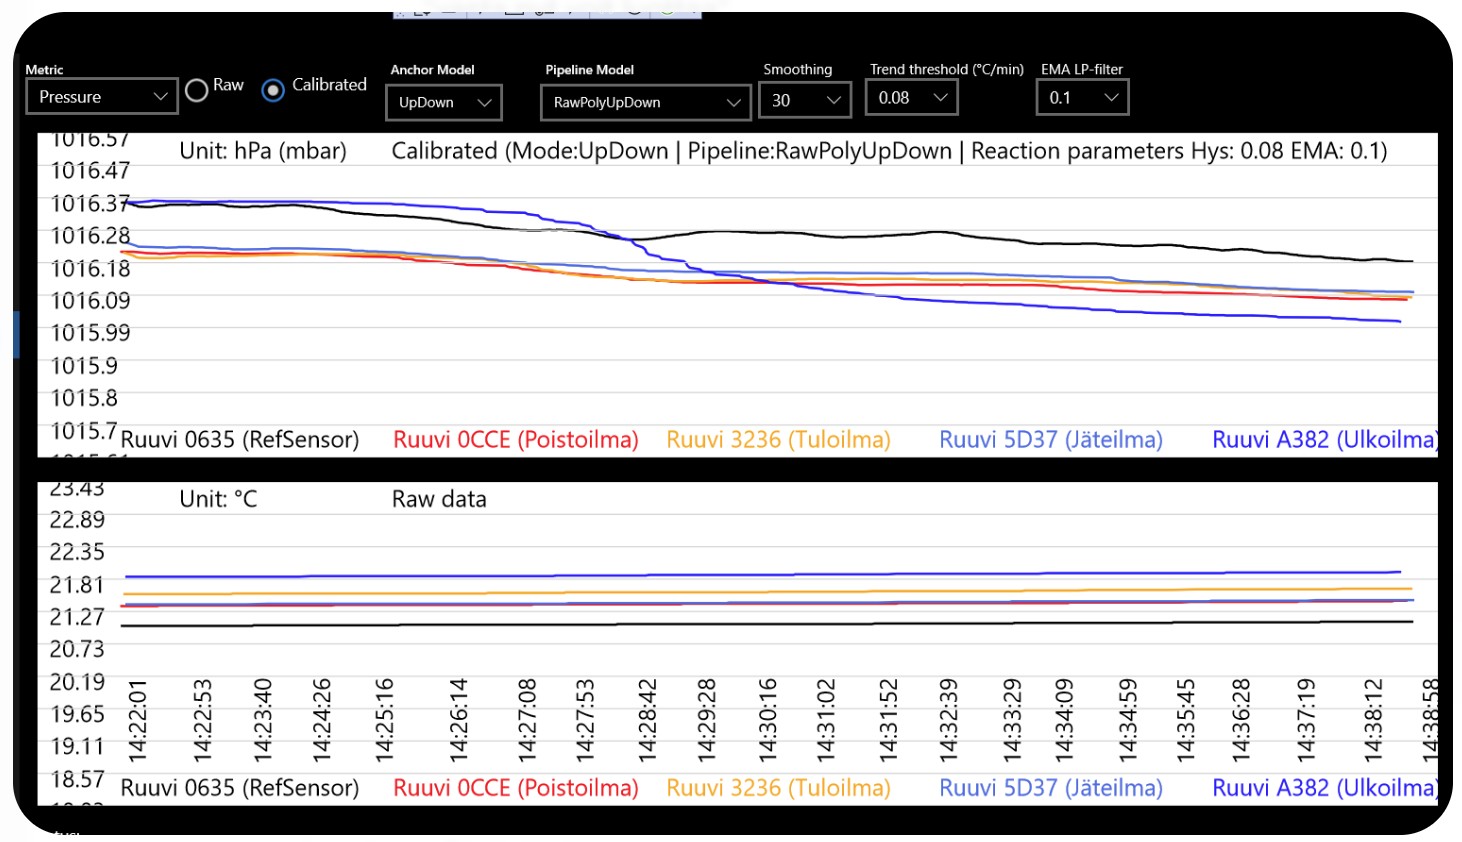
Challenge 1: Hysteresis and response times. When the temperature trend changes slowly, different sensors react at different rates. This leads to diverging curves during slow transitions (see Images 1 and 2).
Challenge 2: Random drift. Occasionally, a single sensor starts to drift for no apparent reason. For example, in Image 3, sensor A382 shows a pressure drop even though all sensors have been in the same stable environment for several hours.
Questions for the community:
Do you have any suggestions on how to better handle these drift and response time issues algorithmically?
Are the newer Infineon-based RuuviTags significantly better in terms of absolute accuracy, drift, or response time for this kind of differential measurement?
Based on the DPS310 datasheet, its capacitive nature should be superior in this regard. Has anyone done a direct comparison of long-term stability between these two sensors in a differential setup?
Is there a way to programmatically identify whether a tag has a Bosch or an Infineon sensor (e.g., via the RAW data format or specific manufacturer fields)? If I could identify the sensor type, I could optimize the compensation algorithm for each manufacturer’s specific characteristics.
Thanks in advance for any insights!
Raw data:
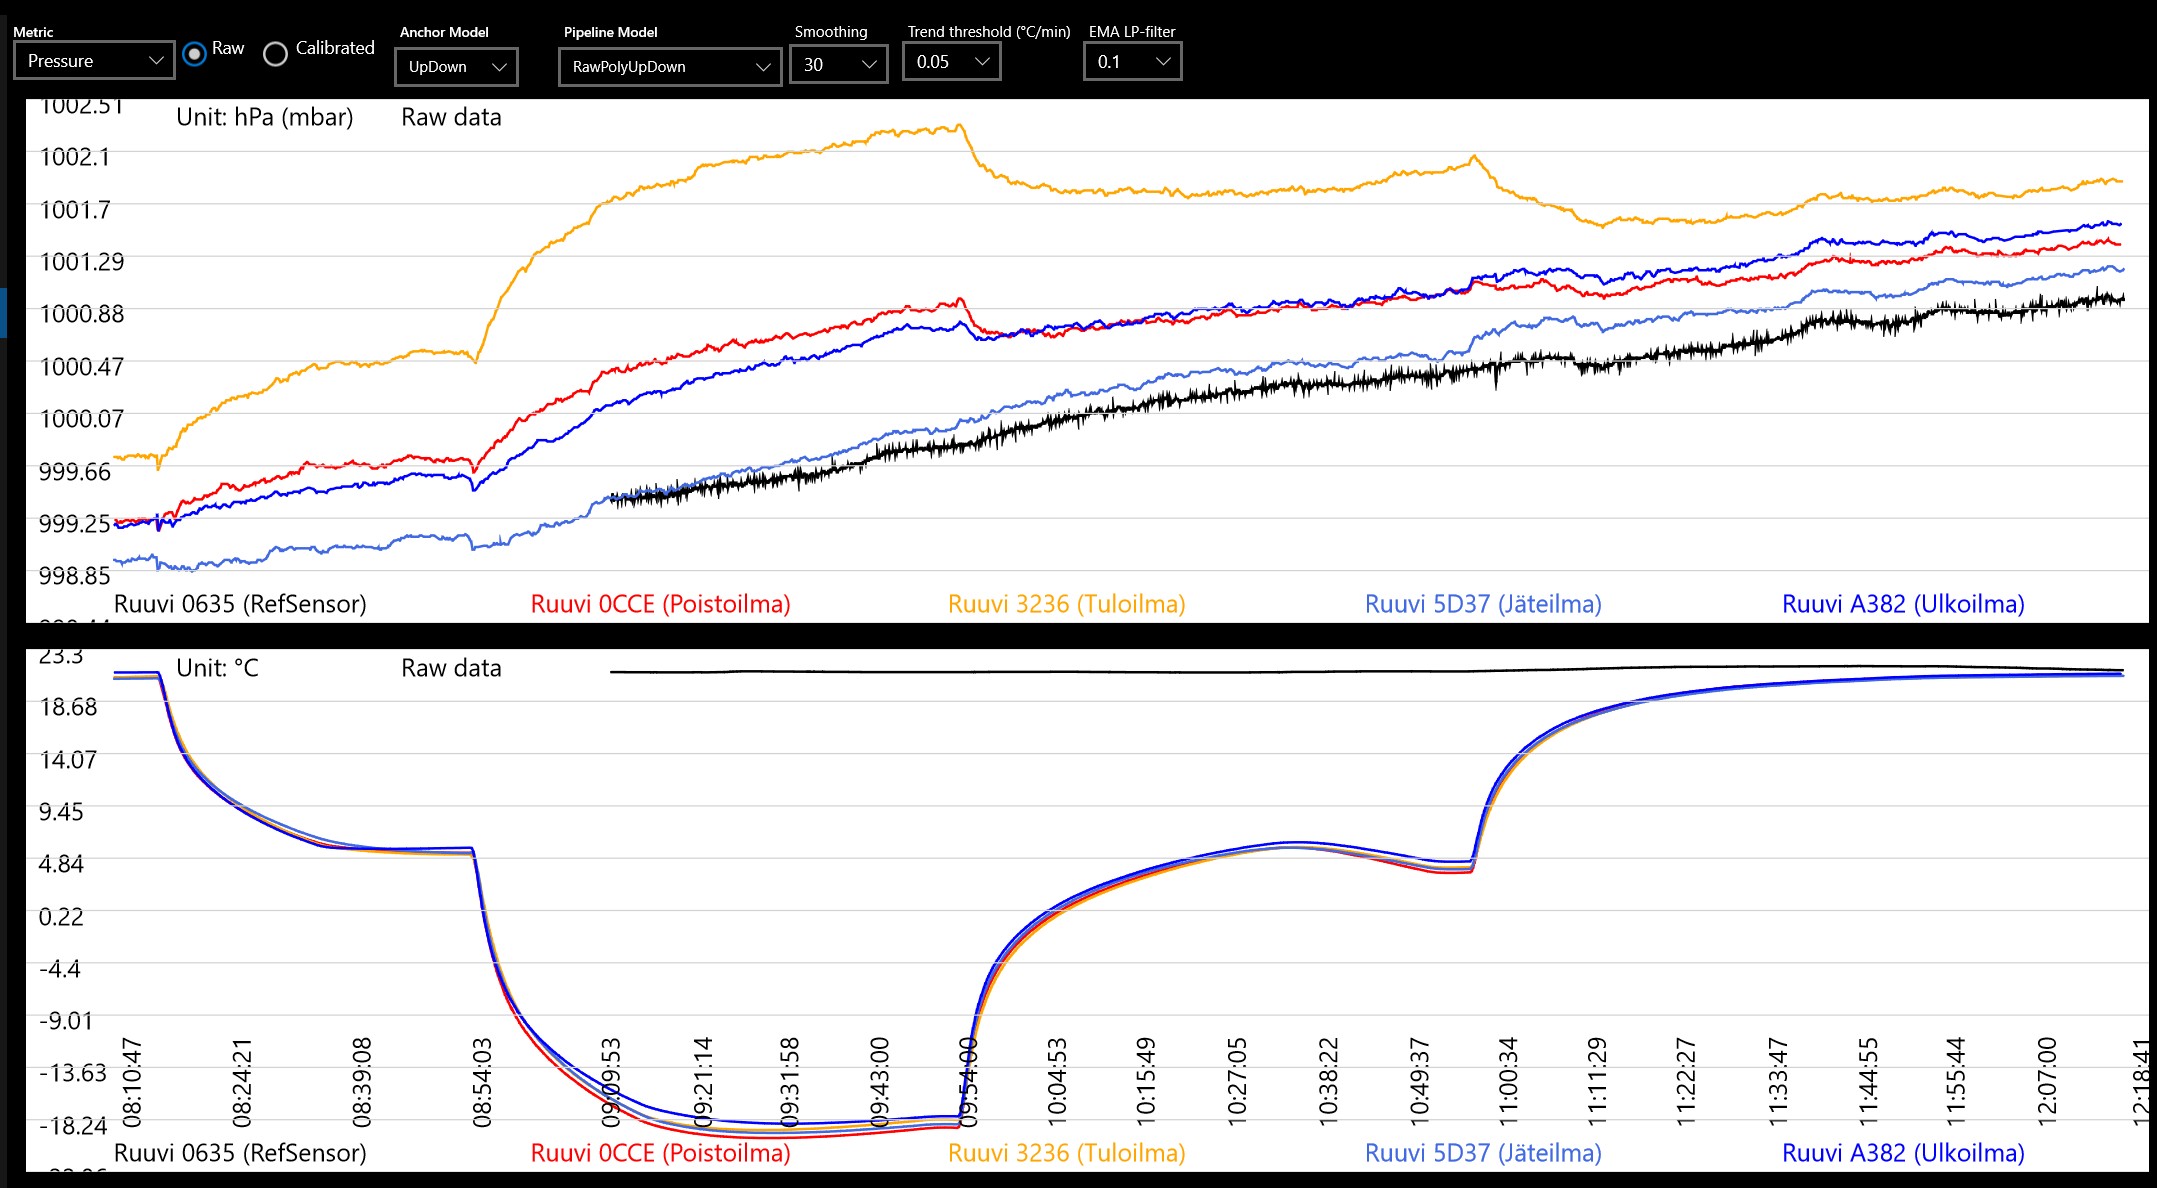
Image 1 & 2
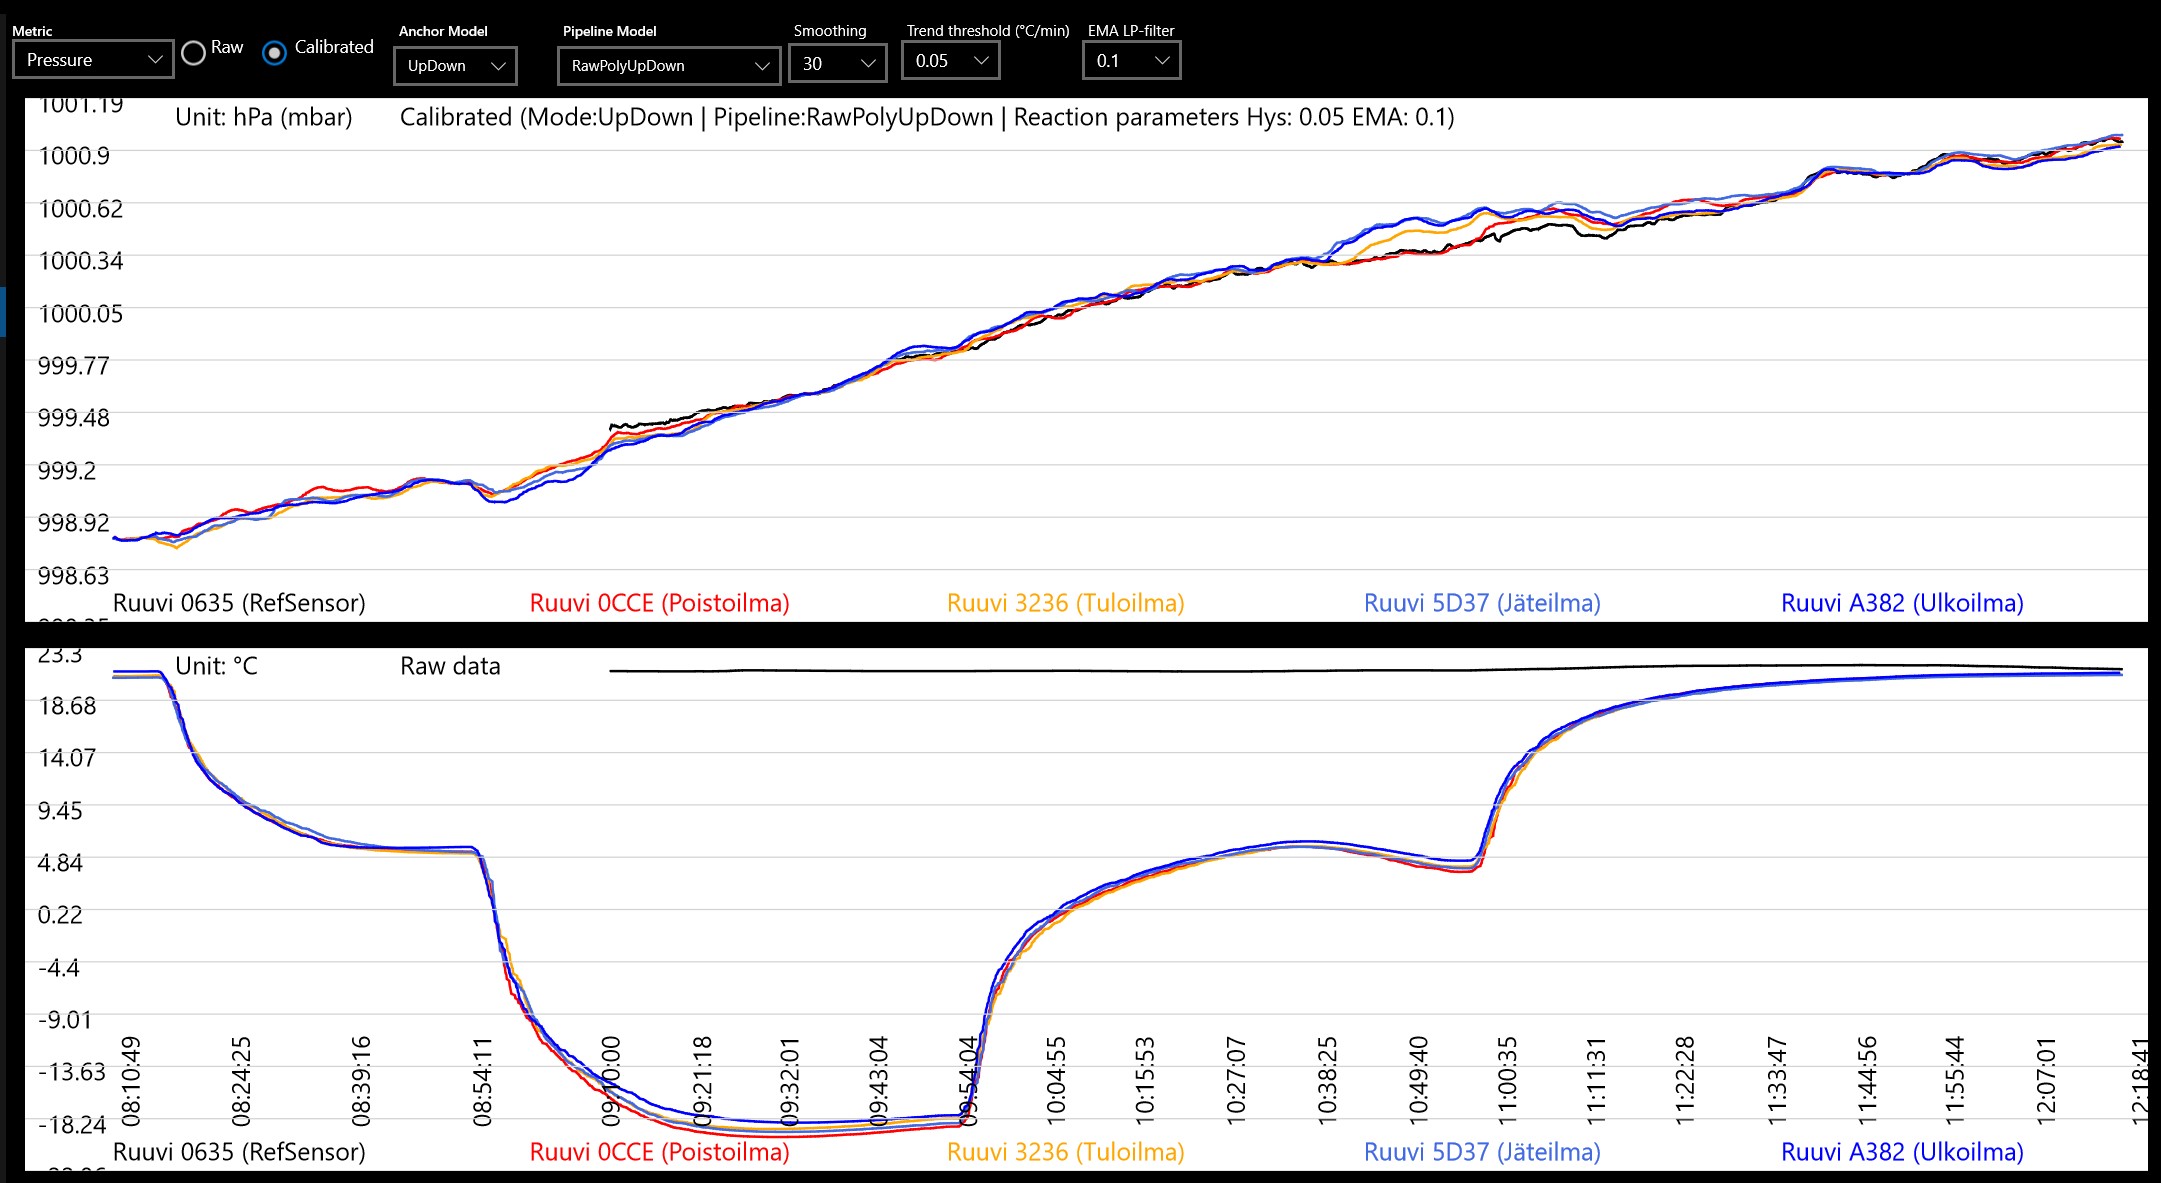
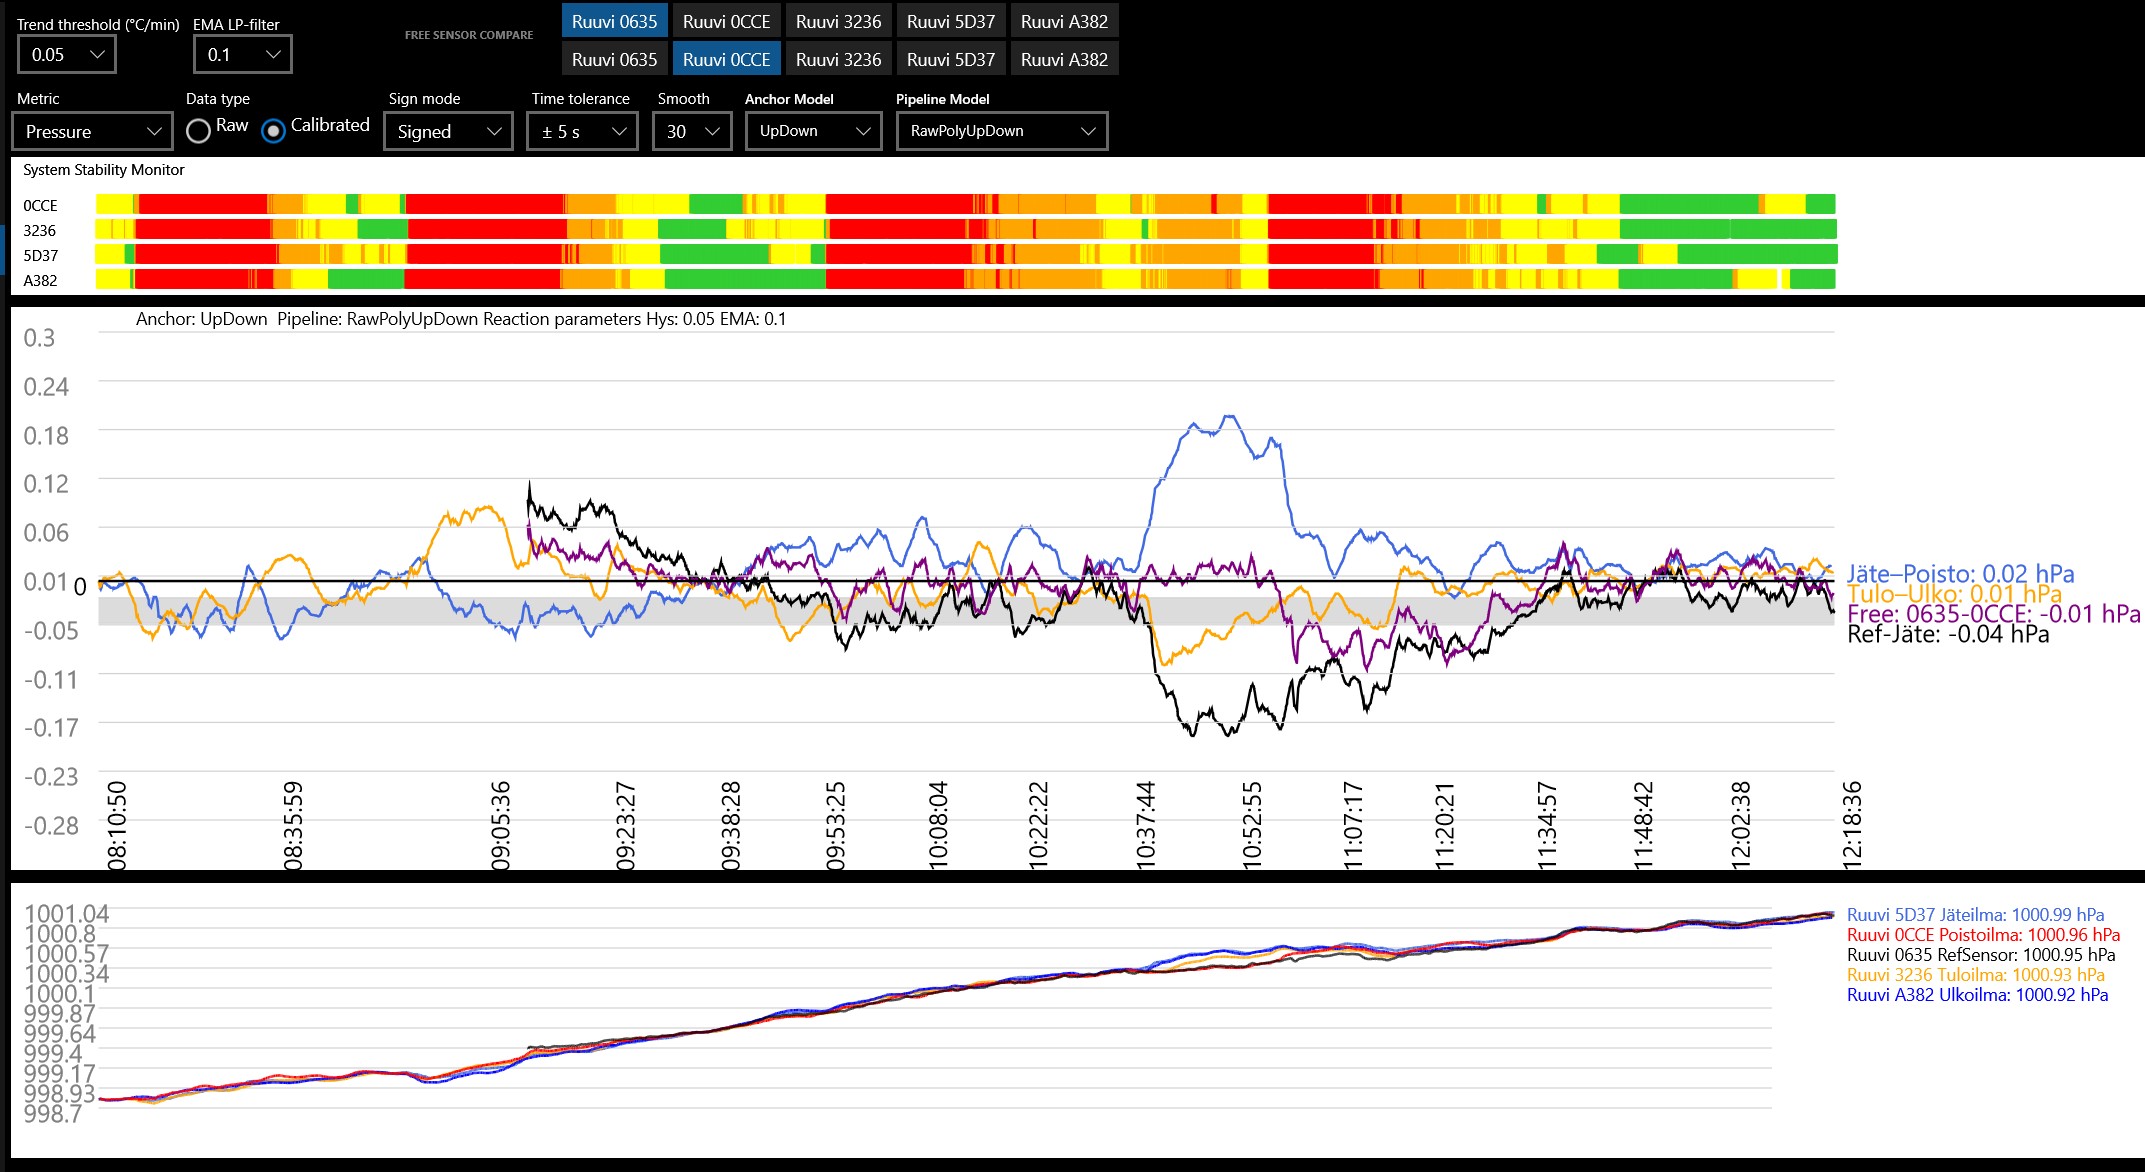
Image 3
1 Like
Hello and thank you for the detailed measurements.
To answer your questions:
Regrettably, no. We have tried to use RuuviTags as differential pressure sensors, but that failed due to the sensor drift. Sensors stay in their absolute accuracy specification, but drift inside the accuracy band.
In our experience, they are not suitable for differential measuring. We have not tested the difference for this use case between the sensor models
We have not done such a test, but data sheet values can be assumed to be correct
We started delivering units with DPS310 since 2021 or 2022 if I recall correctly, all modern Tags have DPS310. There’s nothing in firmware or data format that would report the sensor model.
1 Like