When in “all Tags” view, the time axis shows all zeroes. When in “insgle Tag” view, the time time axis looks ok. I installed the Gateway today, so maybe things settle in a few days, but it is odd that the time axes are different in different views.
Yeah, this is most probably because the cloud doesn’t have much history available. We’ll make this look better with little history.
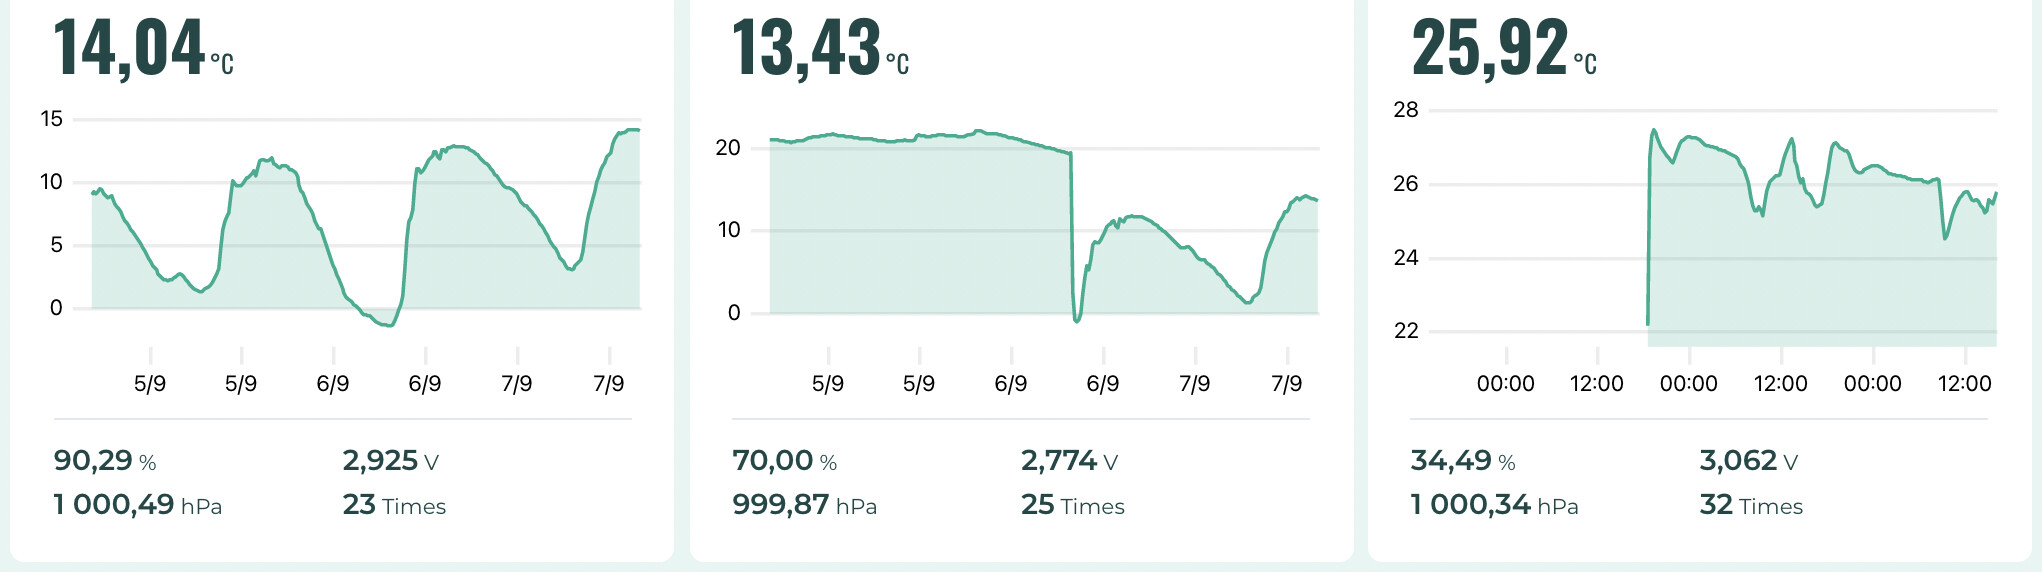
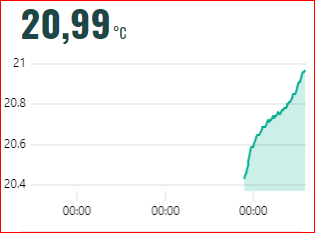
Please compare these two
- All Tags view of one sensor has time as 3 times 00:00
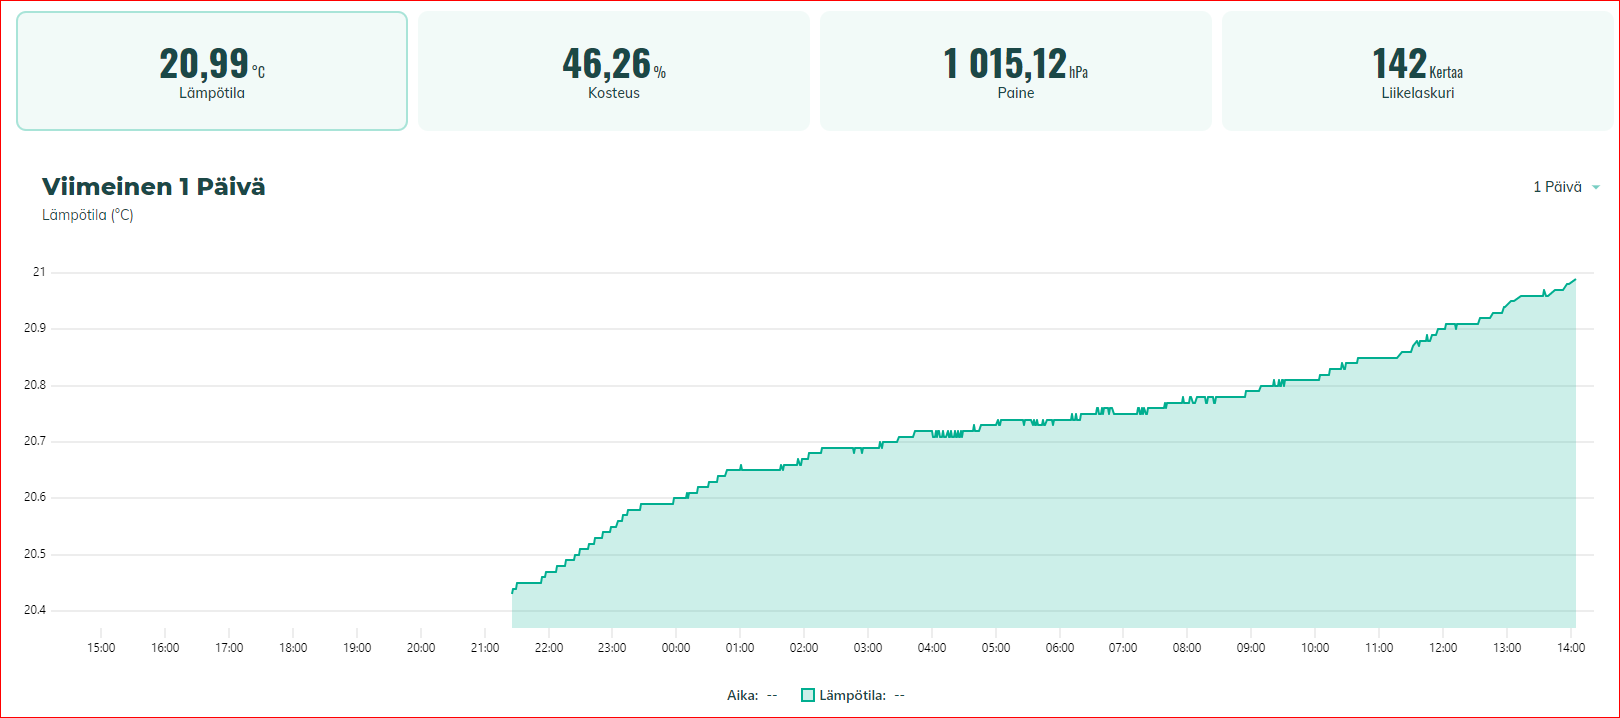
- Single Tag view of the same sensor has time displayed correctly
My only explanation is that the All Tags view actually shows 3 days, the the 3 different 00:00’s are at the start o feach day. It looks, however, like an error. Maybe you should add dates to the All Tags views to make it clearer.
Yes, that’s correct. We’ve got some cool dashboard customisation ideas, but before those will be implemented, like you suggested, we could put dates over there.
Hmm… But actually now when I’m testing it more, some of my sensors show dates and some don’t. Depending of the available history length, it seems. I’ll create an issue about this and it will be unified. Thanks for the report.