Hello,
I recently had to reinstall Ruuviberry on my Raspberry Pi 3 and now the grafana readouts don’t look as they should.
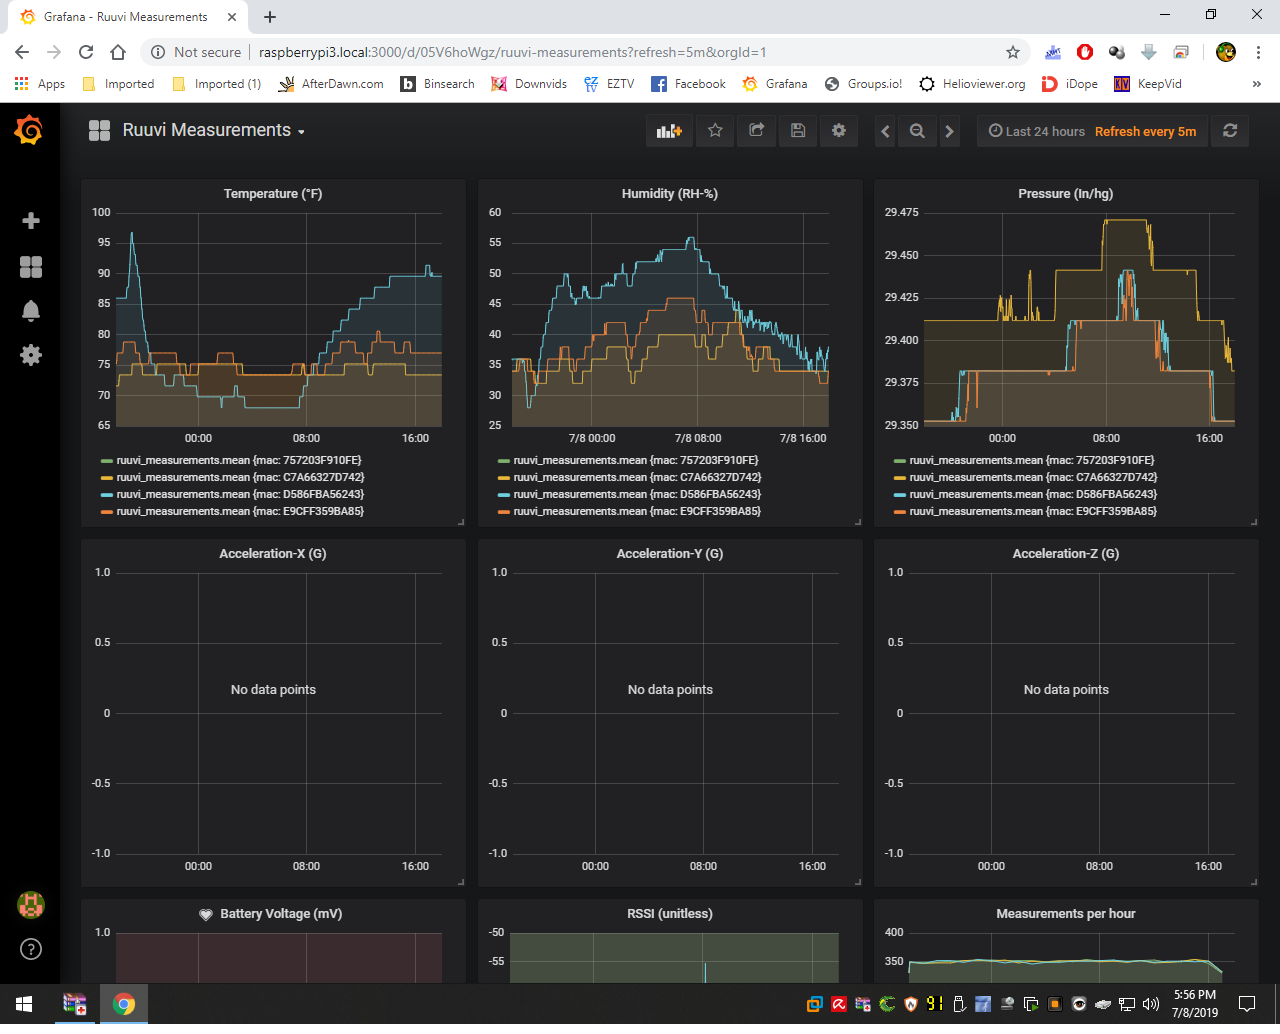
I am enclosing a screenshot so you know what I’m referring to.
Any ideas??
Hello,
I recently had to reinstall Ruuviberry on my Raspberry Pi 3 and now the grafana readouts don’t look as they should.
I am enclosing a screenshot so you know what I’m referring to.
Any ideas??
First thing that comes to my mind is that your tag might be running in URL-mode.
If you’re running the factory firmware 1.2.12 the URL-mode can be identified by green led blinking on tag, you can press “B” to enter raw mode which has higher precision on data.
The bluetooth icon on my R-Pi3 is blinking from blue to green…Any ideas?
Ok, I solved the blinking bluetooth icon on my R-Pi3 but does anyone know why the Grafana readout is so “square-ish”??
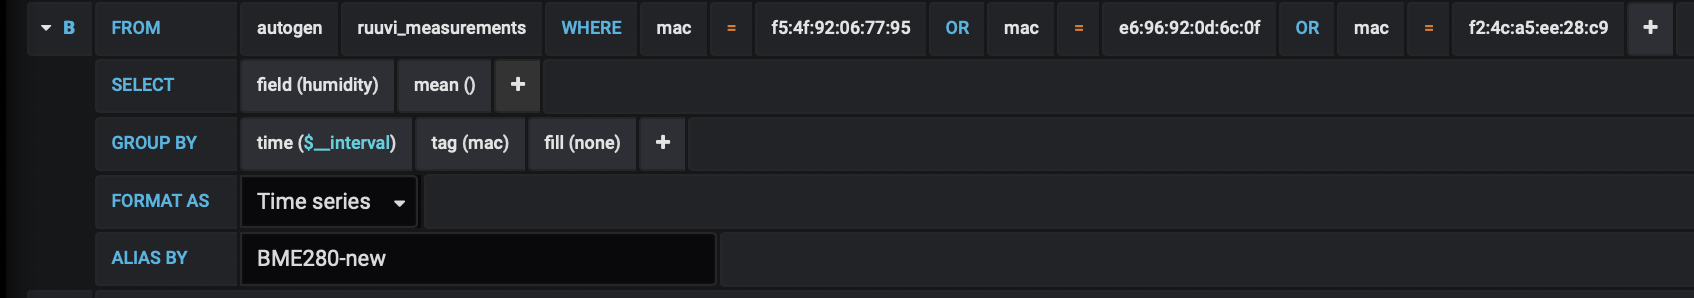
Have you ensured that you are using a raw format on the tag (data formats 3 or 5)? You can quickly check that in grafana by adding another GROUP BY clause as tag(dataFormat) which should turn the default label into something like: ruuvi_measurements.mean {dataFormat: 5, mac: E46E1098918A}
Ok, I think I fixed the graph issue but now a new issue: It only shows data from one ruuvi. How do I configure for all 3?? They’re all working BTW.
You’ll need to configure group_by: tag(mac)
How do I do this? I’m not familiar with Grafana. I’m a newbie.
Thanx in Advance.
I did this for temperature and now no readout for the 3 ruuvitags
Ok I think I got it…Thanx!!
It still looks square-ish…What time interval should I set for the graphs??I had it set for 5 seconds…I moved it up to 5 minutes…What should the settings be for the Time Interval?
5 seconds should be good. Did you verify the data format already? Which one are you using?
The data format is Time Series.
I mean the data format (a number, normally 2, 3, 4 or 5) sent by the tags, which is stored in the dataFormat tag field as I explained in my earlier post
I fixed the issue…I deleted each graph and reinstalled them which loads their default values.