I get the result below. Pretty much the same infor from journalctl. But previously I did get the following info from tailf on grafana.log:
lvl=crit msg=“Fail to connect to database” logger=sqlstore error=“Unknown database type: influxDB”
But I am positive that Influx is running. And I thought before that this was the name that Grafana uses for an Influx DB. I’ve tried a capital I, InfluxDB, as well.
● grafana-server.service - Grafana instance
Loaded: loaded (/usr/lib/systemd/system/grafana-server.service; enabled; vendor preset: enabled)
Active: failed (Result: exit-code) since Mon 2018-03-05 10:20:26 EST; 15min ago
Docs: http://docs.grafana.org
Process: 763 ExecStart=/usr/sbin/grafana-server --config=${CONF_FILE} --pidfile=${PID_FILE_DIR}/grafana-server.pid cfg:default.paths.logs=${LOG_DIR} cfg:default.paths.data=${DAT
Main PID: 763 (code=exited, status=1/FAILURE)
That error looks a bit like you have accidentally configured (or tried to) use InfluxDB as a database for storing Grafana settings, which is not supported. In /etc/grafana/grafana.ini under the [database] section, have you configured something? if so, remove those. The datasource for the graphs (InfluxDB) should be configured through the Grafana UI, not through the ini config
[face-palm] Yes, I was fiddling in that section of grafana.ini. I thought that section was for specifying the database to access. Problem solved and lessons learned! Thanks!
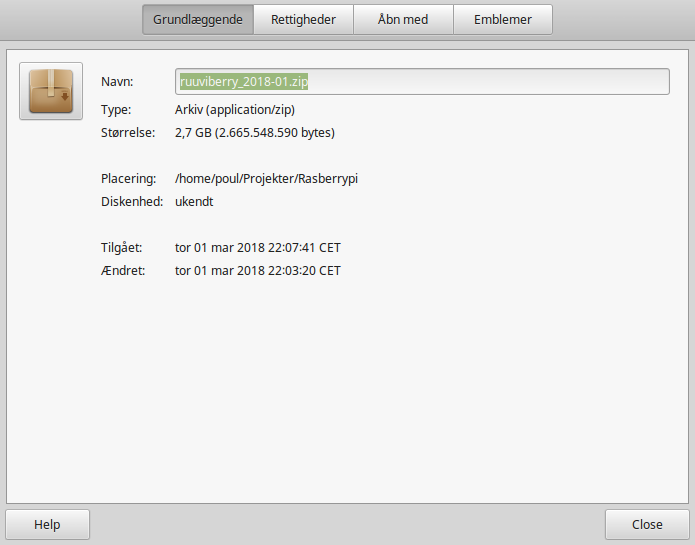
i can’t get this image burned to a card. Have tried both macos and win10 with etcher. In the end of the writing to disk an error message. Neither can it be verified or unpacked. crc error with 7zip.
I wanted to use the finished raspberry image and downloaded it from the Google Drive. Unfortunately, I always get a CRC error. Could someone check if he also has the problem with the image? Many Thanks!
I’ve had a few reports of successful install, but apparently there is some problem with the image I’ll make a new one, and shrink the image size while I’m at it.
I downloaded 1 March “ruuviberry_2018-01.zip” and unpacked it, and it took over 4 hours to get an image on an SD card. 16GB. But otherwise everything will be fine.
First of all thanks for the image, got it working on a first try with wifi and all. Next step will be finding the perfect spot for Raspi so that all tags are within range.
Also I tried to modify the existing default dashboard on Grafana. I tried but could not find a way to name the tags according to the mac addresses. What would be the best way to give them names based on location, so they would be displayed in the legends correctly?
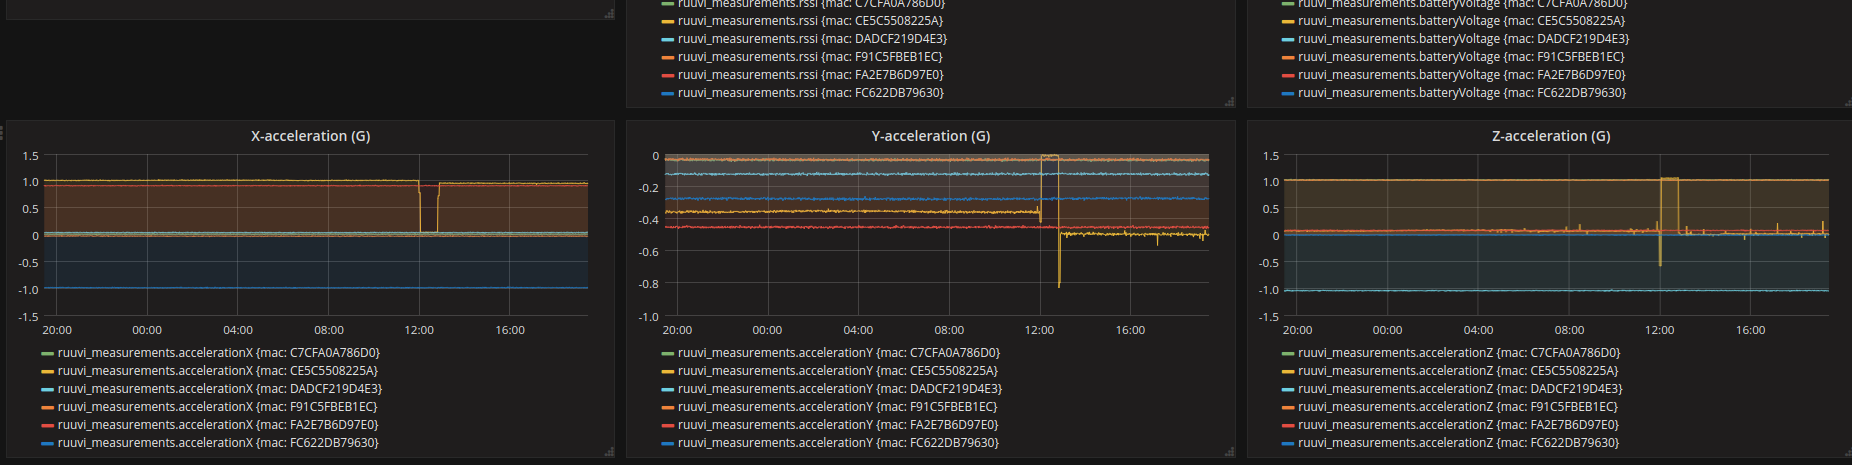
My experience shows that small changes in location of either the tags or the receiver (Raspi) (as little as 10-20 cm and not necessarily towards each other) can result in dramatic change of rssi observed (as much as 10 or even 20 dB). So my advice is to find a reasonable and convenient spot for the Pi first and then, if not all the tags are reliably visible, try moving the problem tags or the Pi just a little bit and check the results.
The best way by far of assigning names to macs is to use RuuviCollector’s ruuvi-names.properties file. There’s an example file provided and it’s nicely documented right in the file itself.
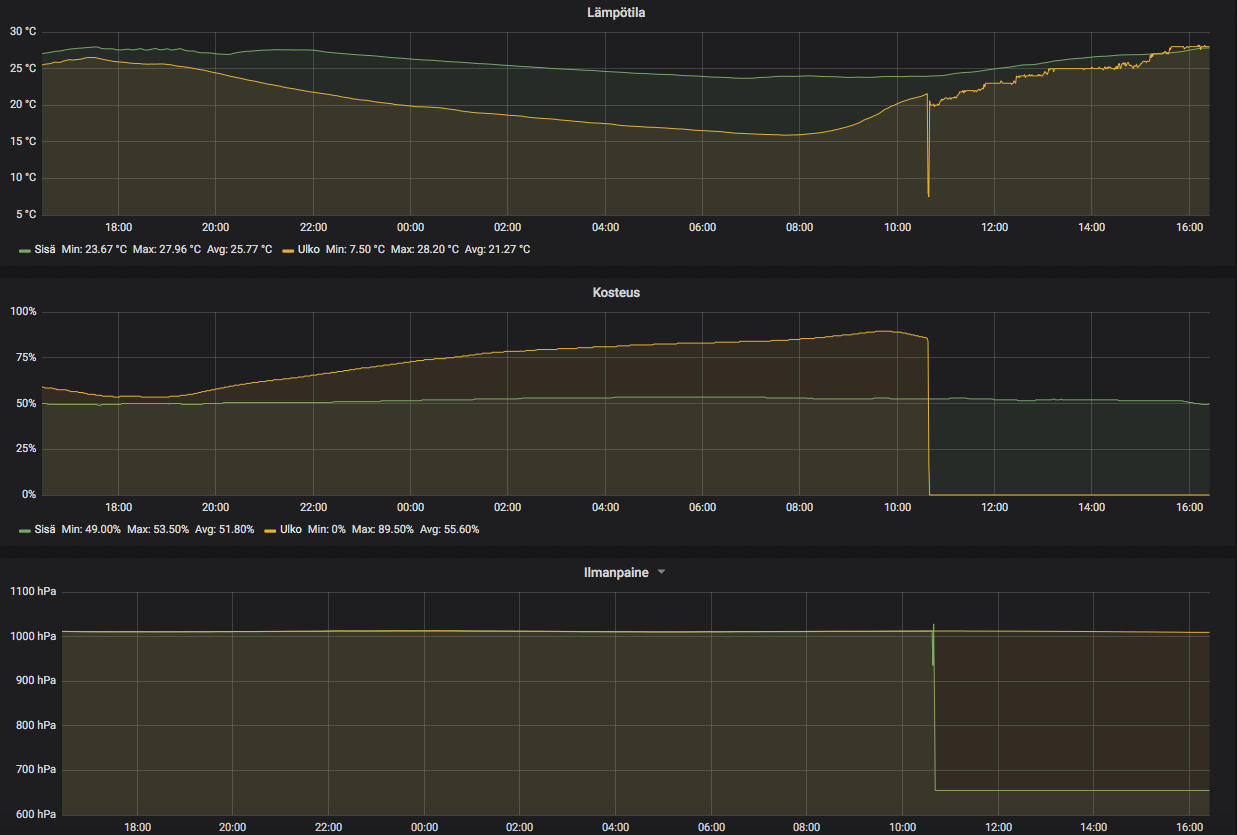
One thing which comes to my mind is that the BME280 would have failed and tag switches over to nRF52 temperature sensor. It would explain why temperature readings suddenly become a lot more noisy and humidity and pressure readings are zero. Is there any visible damage to the board? Can you try the tag with a new battery?
I got it back to business. I had to remove the battery about 10 times and then it started to give some other lights than solid red light. So when I removed the battery and put it back, i got just constant red light but I couldn’t connect to the tag. After couple of reset cycle it started to work normally. I got the tag week ago so the battery shoulnd’t be so old.
I believe it was Scrin who observed some time ago that “wiggling” the battery a bit can improve contact if some dust or whatever gets between the battery and the clip. If the contact is bad, the battery can provide acceptable voltage when idle but it will dip substantially under peak loads, like when booting up or transmitting, which can lead to constant rebooting.
 I’ll make a new one, and shrink the image size while I’m at it.