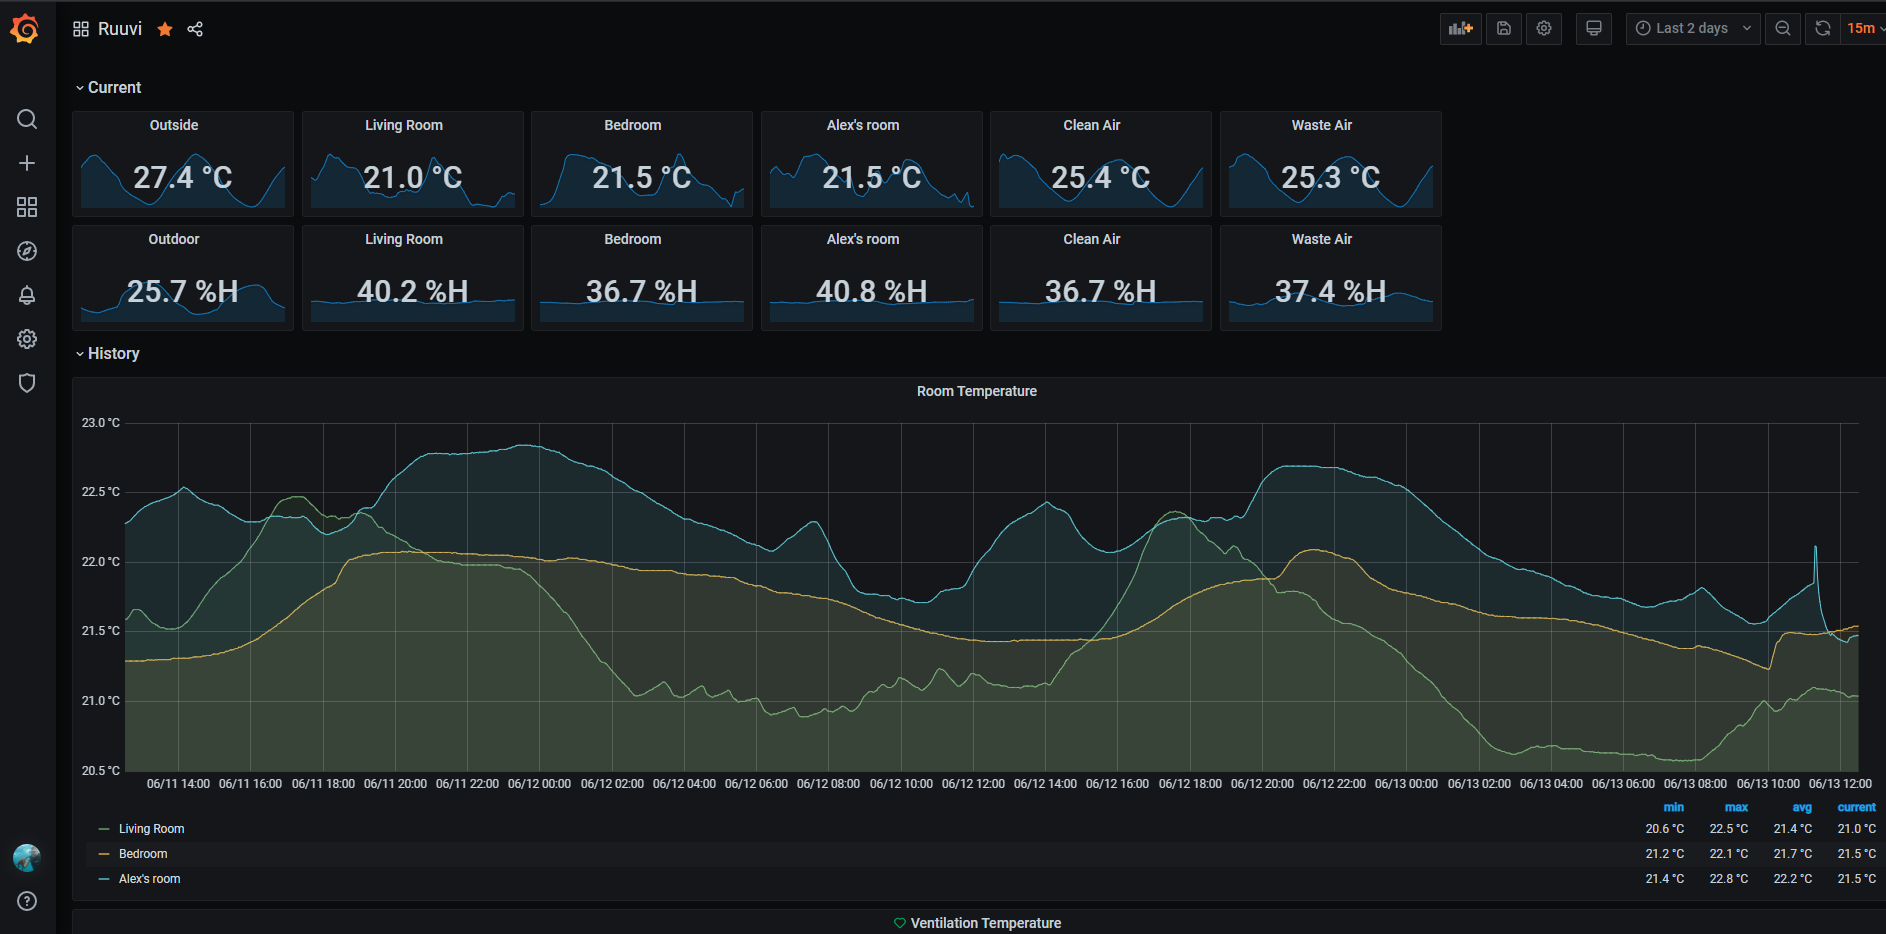
Hi all, I have a setup of 6 Ruuvitag bluetooth beacons, and a Raspberry Pi with RuuviCollector. On the same device, I have Grafana running, and have created a dashboard with some measures and panels:
Now my issue is that the hostnames are MAC-codes, and at the moment I have them hard-coded by using “alias by”, depending on where the Ruuvitags are. What I would like to have is a way to maintain information about where a given Ruuvitag was at a certain time, and thus display only relevant data on the dashboard.
As an example, I have a tag that I initially had in my office room. I then moved it outdoors. I would like to separate these two situations in Grafana according to the metadata maintained manually, so that I get a valid min and max ranges for the office, and outdoors temperature. How could I achieve this?
The tag naming feature of RuuviCollector is intended for this kind of use case; when the collector saves a measurement, it applies the currently configured name (in addition to the MAC address) to the measurement, without affecting past measurements.
This allows you to use the name to track different places or other use cases, while still being able to use the mac to keep track of the physical tags. Of course if you frequently move tags around, it might be a bit cumbersome to keep updating the name config and restarting the collector when you move tags around.
Your use case is actually the reason I implemented a tag naming system on the collector side, as I was unable to find any other convenient ways to conveniently “rename” tags as I moved them around. Of course it has been a few years since then and a lot has changed in Grafana and InfluxDB so if someone knows about other/better ways these days please share.
Holy smokes, that’s perfect! I thought of this, but didn’t want to fiddle with the collector.
It’s pretty rare that I move them around, so that won’t be an issue. Thanks for the feature and the answer!
Is there something new in grafana.com, public key not available?
I tried to apt update as usual
Err:5 https://packages.grafana.com/enterprise/deb stable InRelease
  The following signatures couldn't be verified because the public key is not available: NO_PUBKEY 9E439B102CF3C0C6
Fetched 91,5 kB in 1s (70,5 kB/s)
Reading package lists... Done
Building dependency tree
Reading state information... Done
2 packages can be upgraded. Run 'apt list --upgradable' to see them.
It may or may not be related to this, but my installation stopped collecting data 2023-02-22 05:50. Restarting any of the software makes no difference.
It seems like batteries died or there was contact problem, at least one of my tags has history of turning off because it does not get juice from the battery and reviving as soon i touch it.
It seems that both android app and my raspberry are reading the tags now
So, two separate problems occurred almost simultaneously. Data collecting problems did not have anything to do with grafana changing download server etc.