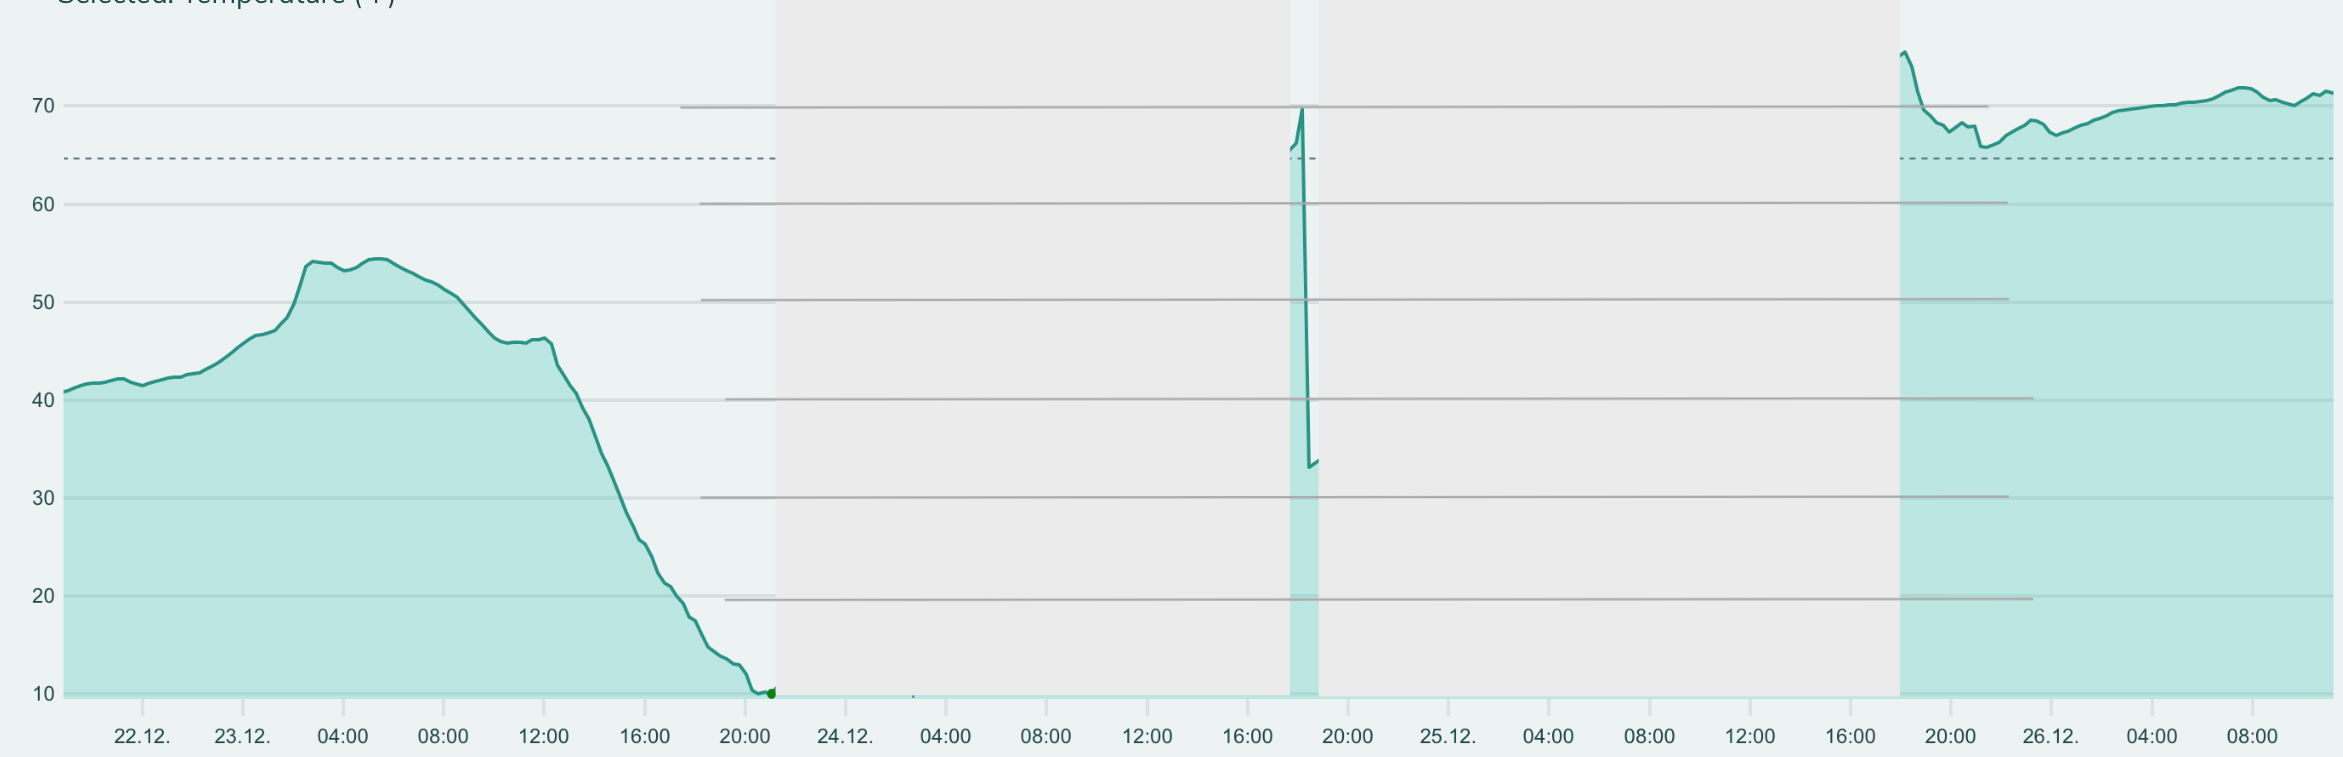
If a stream of data points pauses at t(n), a straight line is only valid if the data resumes at t(n+m) if m is a small number.
as of 2023-01-02

For example: for temperature: if a stream of data pauses at 06:00 at 15C and the resumes at 22:30 at 14C it is NOT valid to draw a straight line DOWN from 15C to 14C between 06:00 and 22:30. It is easy to imagine that, in this scenario that the actual temperature at 10:00 was 16C, at 13:00 was 17C, at 16:00 15C and at 22:30 13C. Of course your actual imagination may vary and produce a totally different scenario.
hypothetical “actual” values chart:
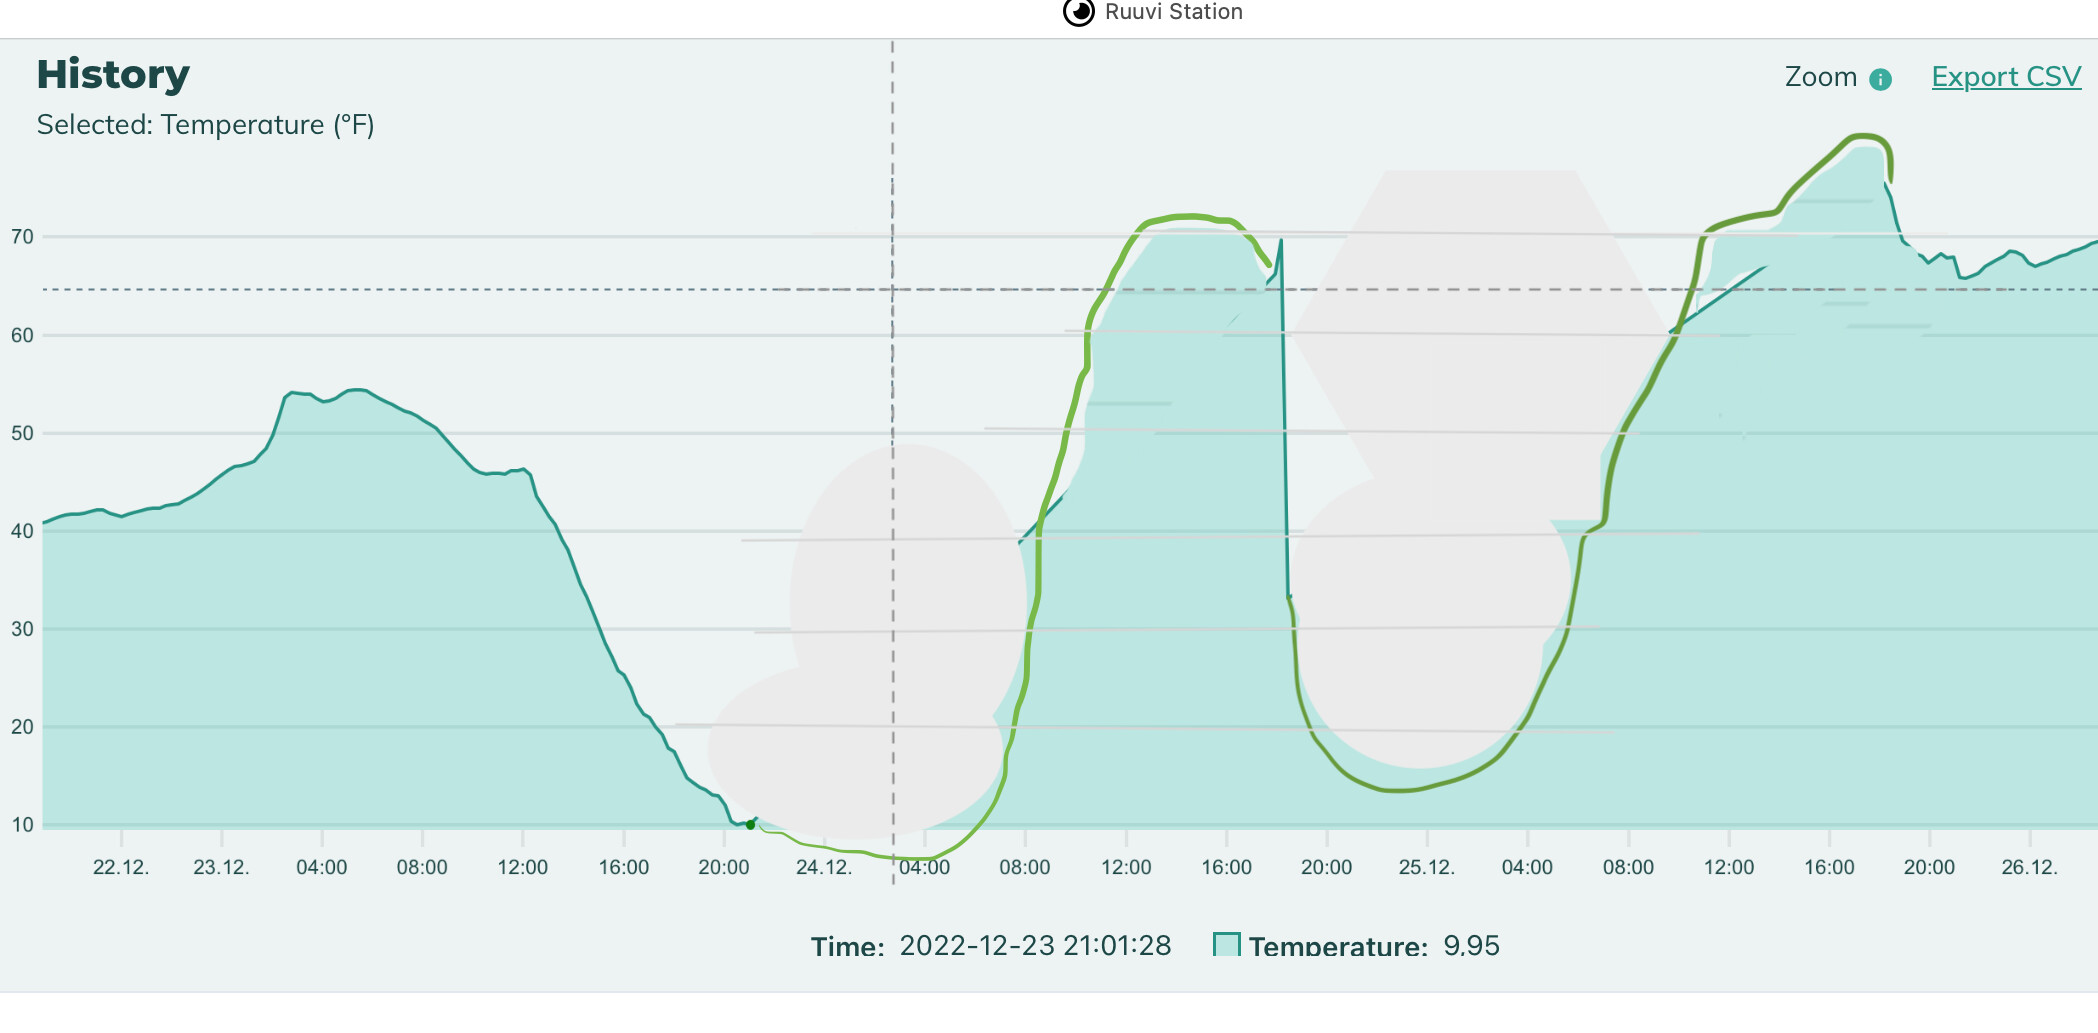
I would suggest something like: