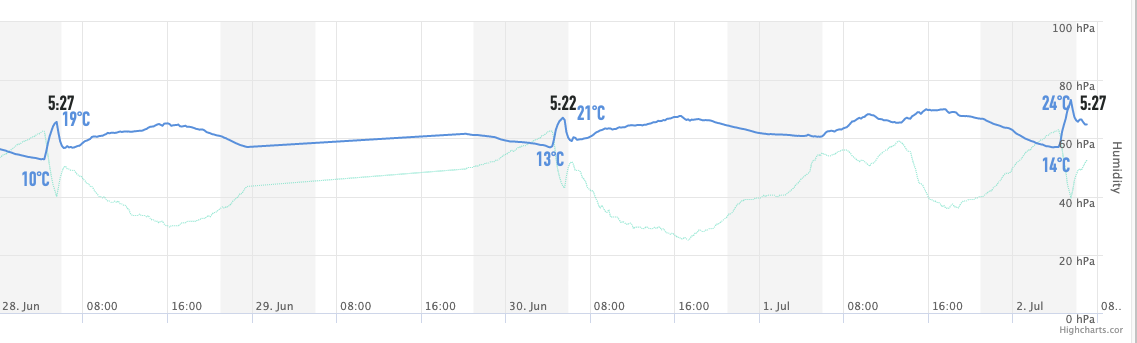
Now that I’ve been building a simple solution (blog post coming later) to collect and store RuugiTag sensor data into cloud, I’ve been noticing somewhat weird anomaly with sensor data: Quite often, the temperature and humidity values have a spike around 5:20 (see attached image). Anyone else getting similar behaviour?
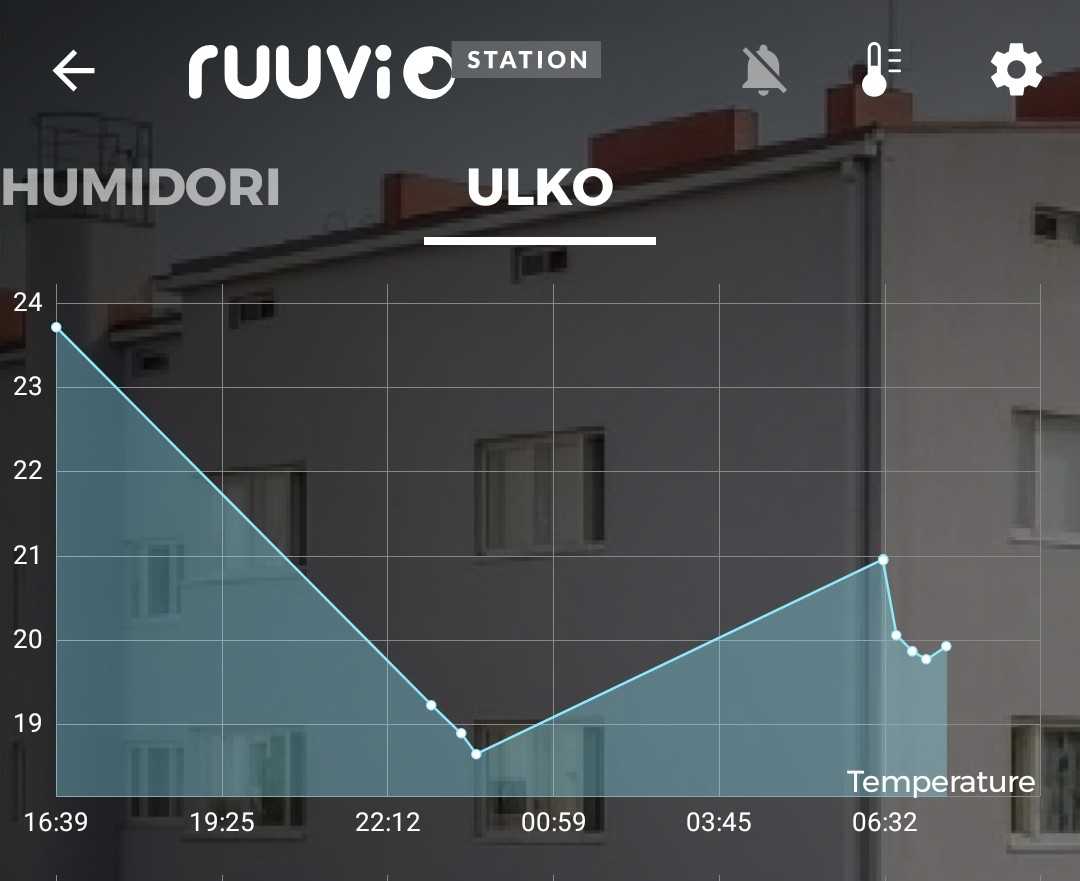
Despite the background scanning, I’m not getting any results from the same time, but from there can also see the sudden temperature drop after first readings:
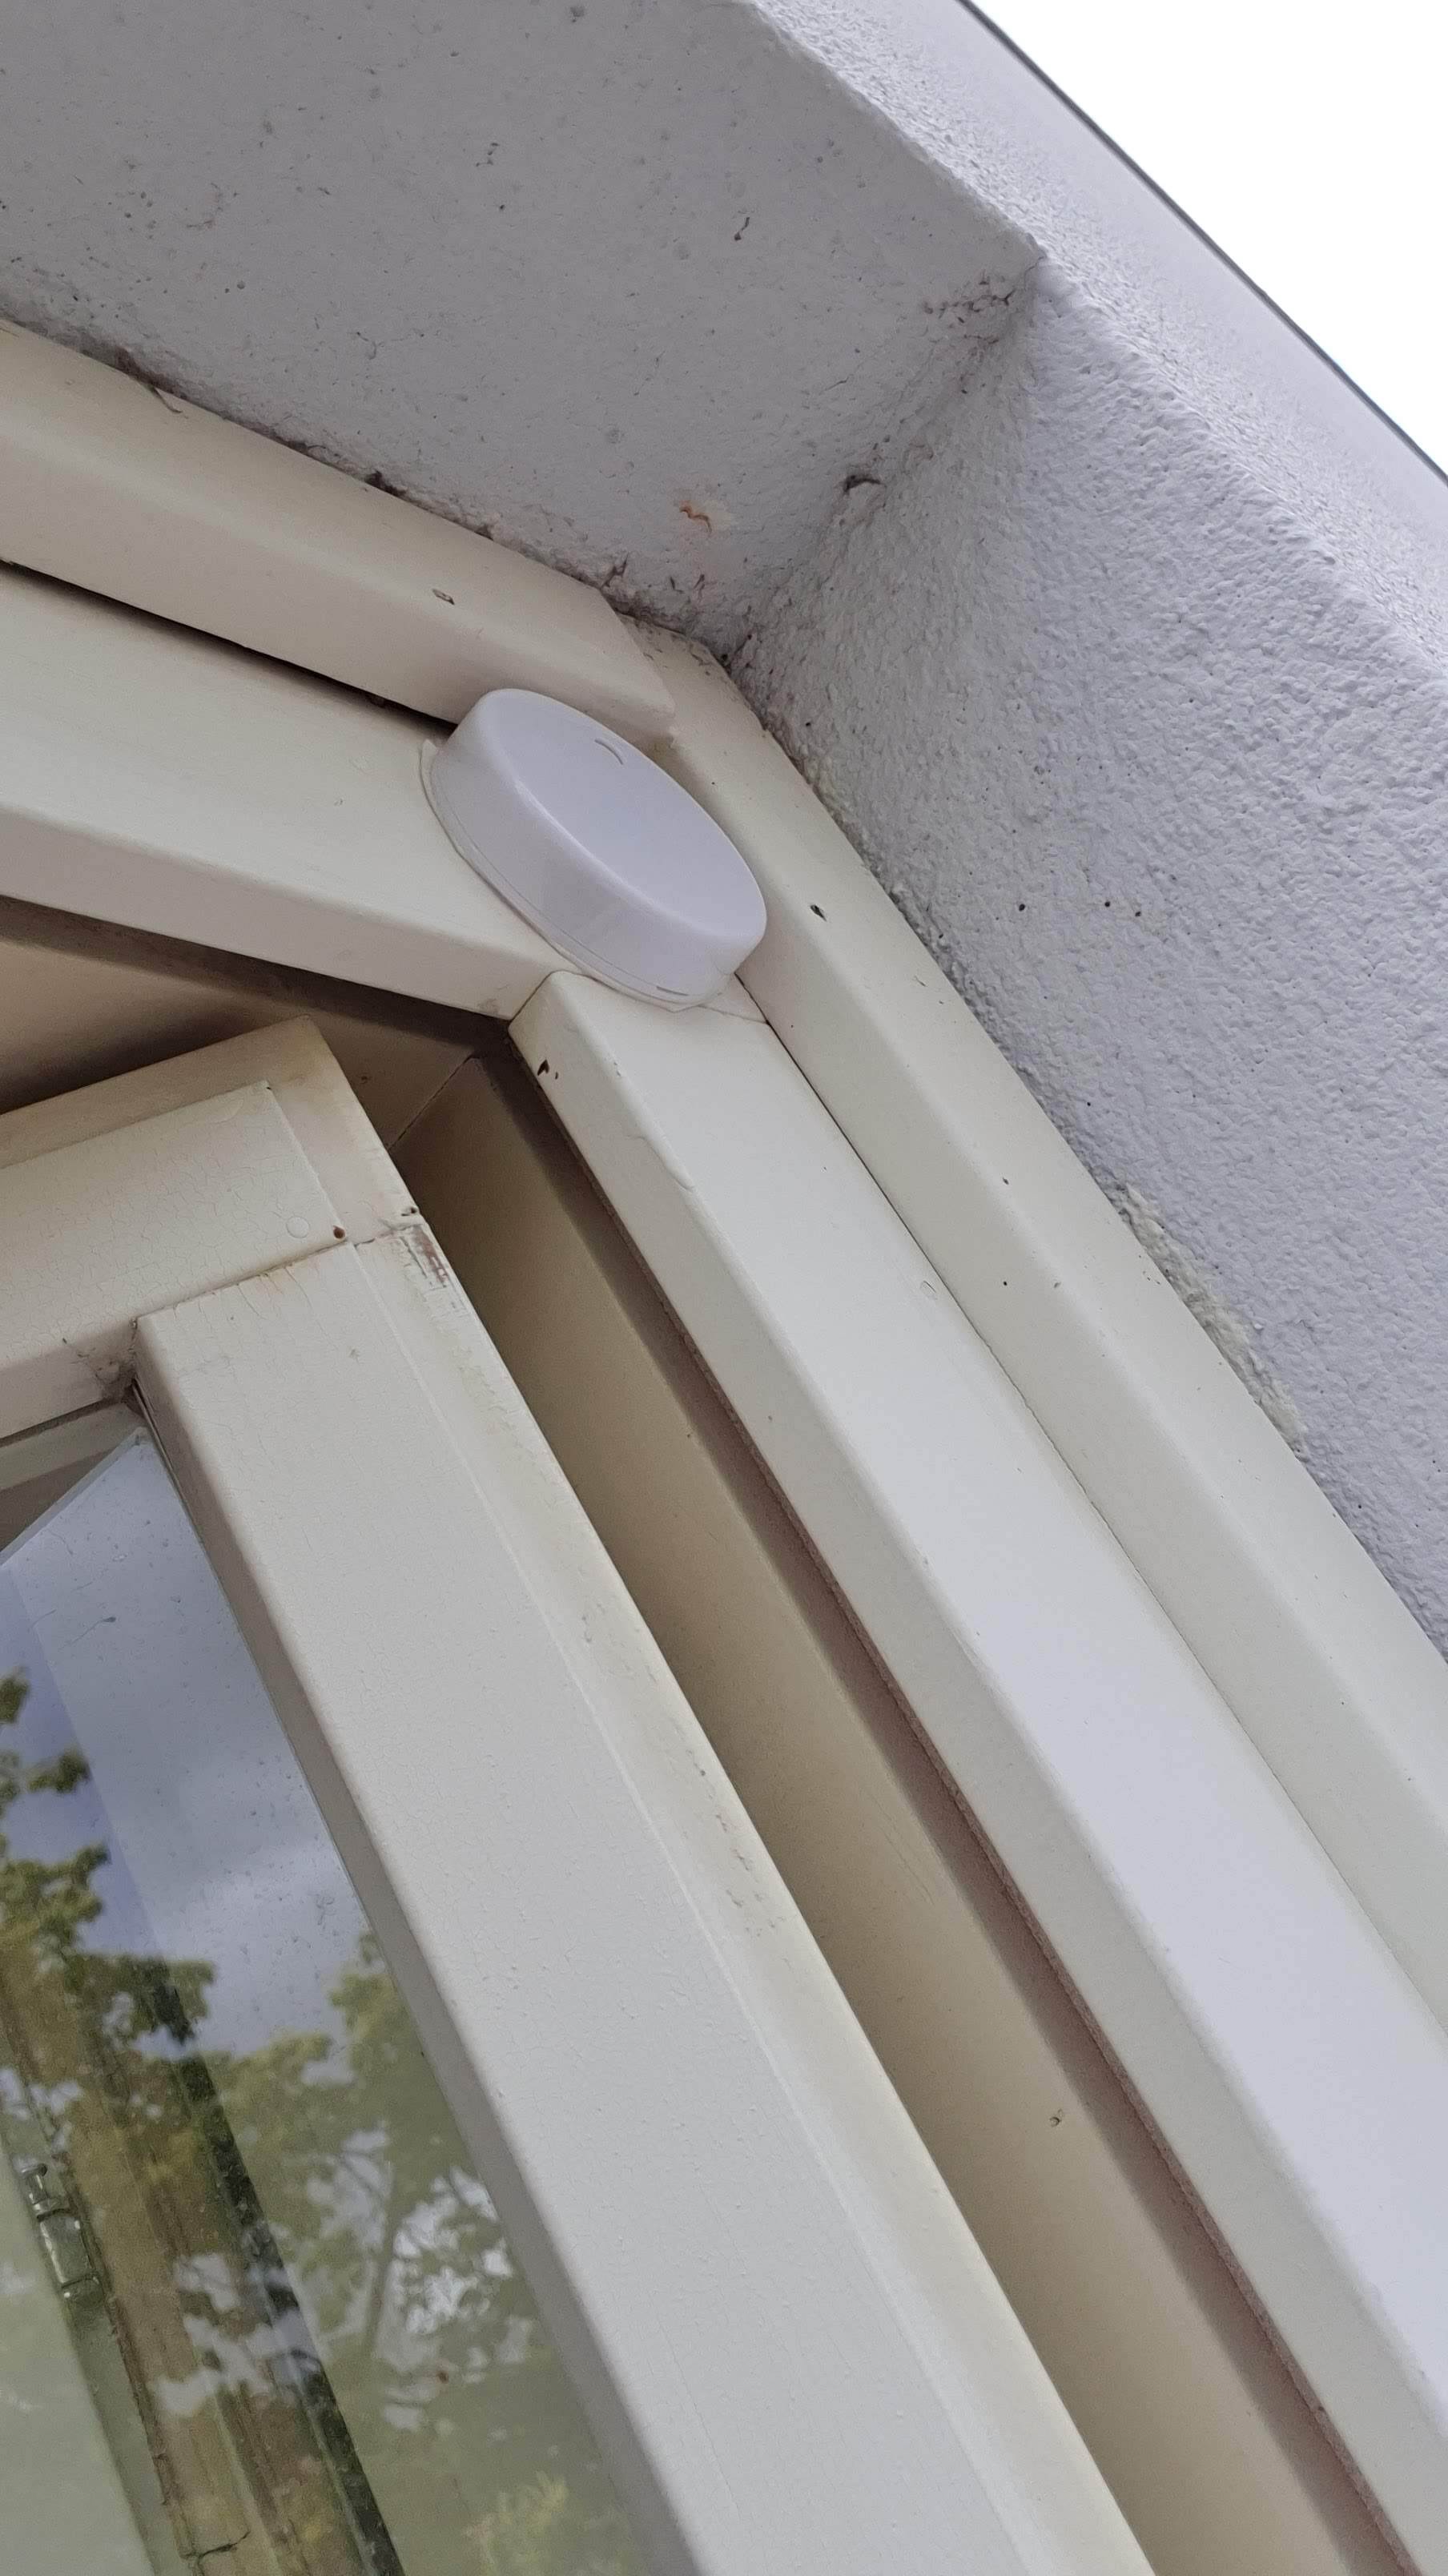
Tag is placed outside the house and data is being collected using Rasperry Pi with node-ruuvitag script. There are no scheduled activities in Rasperry Pi, other than restarting the WLAN connection if it drops out.
Also, worth to add: I have three other RuuviTags (all placed inside, though), and I can’t see any value spikes from those. So, I wonder what happens around my house at mornings?
My bet is the Sun. A direct sunshine in the morning (or any other “heat source”) will sharply increase the temperature and decrease the relative humidity (as it’s directly dependent on the temperature), while the absolute humidity should increase only very slightly (because air and water densities change slightly differently as the temperature changes). The sharp decrease a little time later looks like the tag goes out of direct sunlight at that point, so it may be a short-ish period of time when the sun is able to shine on the tag
Thanks for the replies so far. When looking at the times and the angle, the sun really can be a possibility. Just a bit surprised the temperature can really jump as much as 10C due to direct sun light at mornings.
Will have to collect more data and see if I can reposition the tag even more optimal location
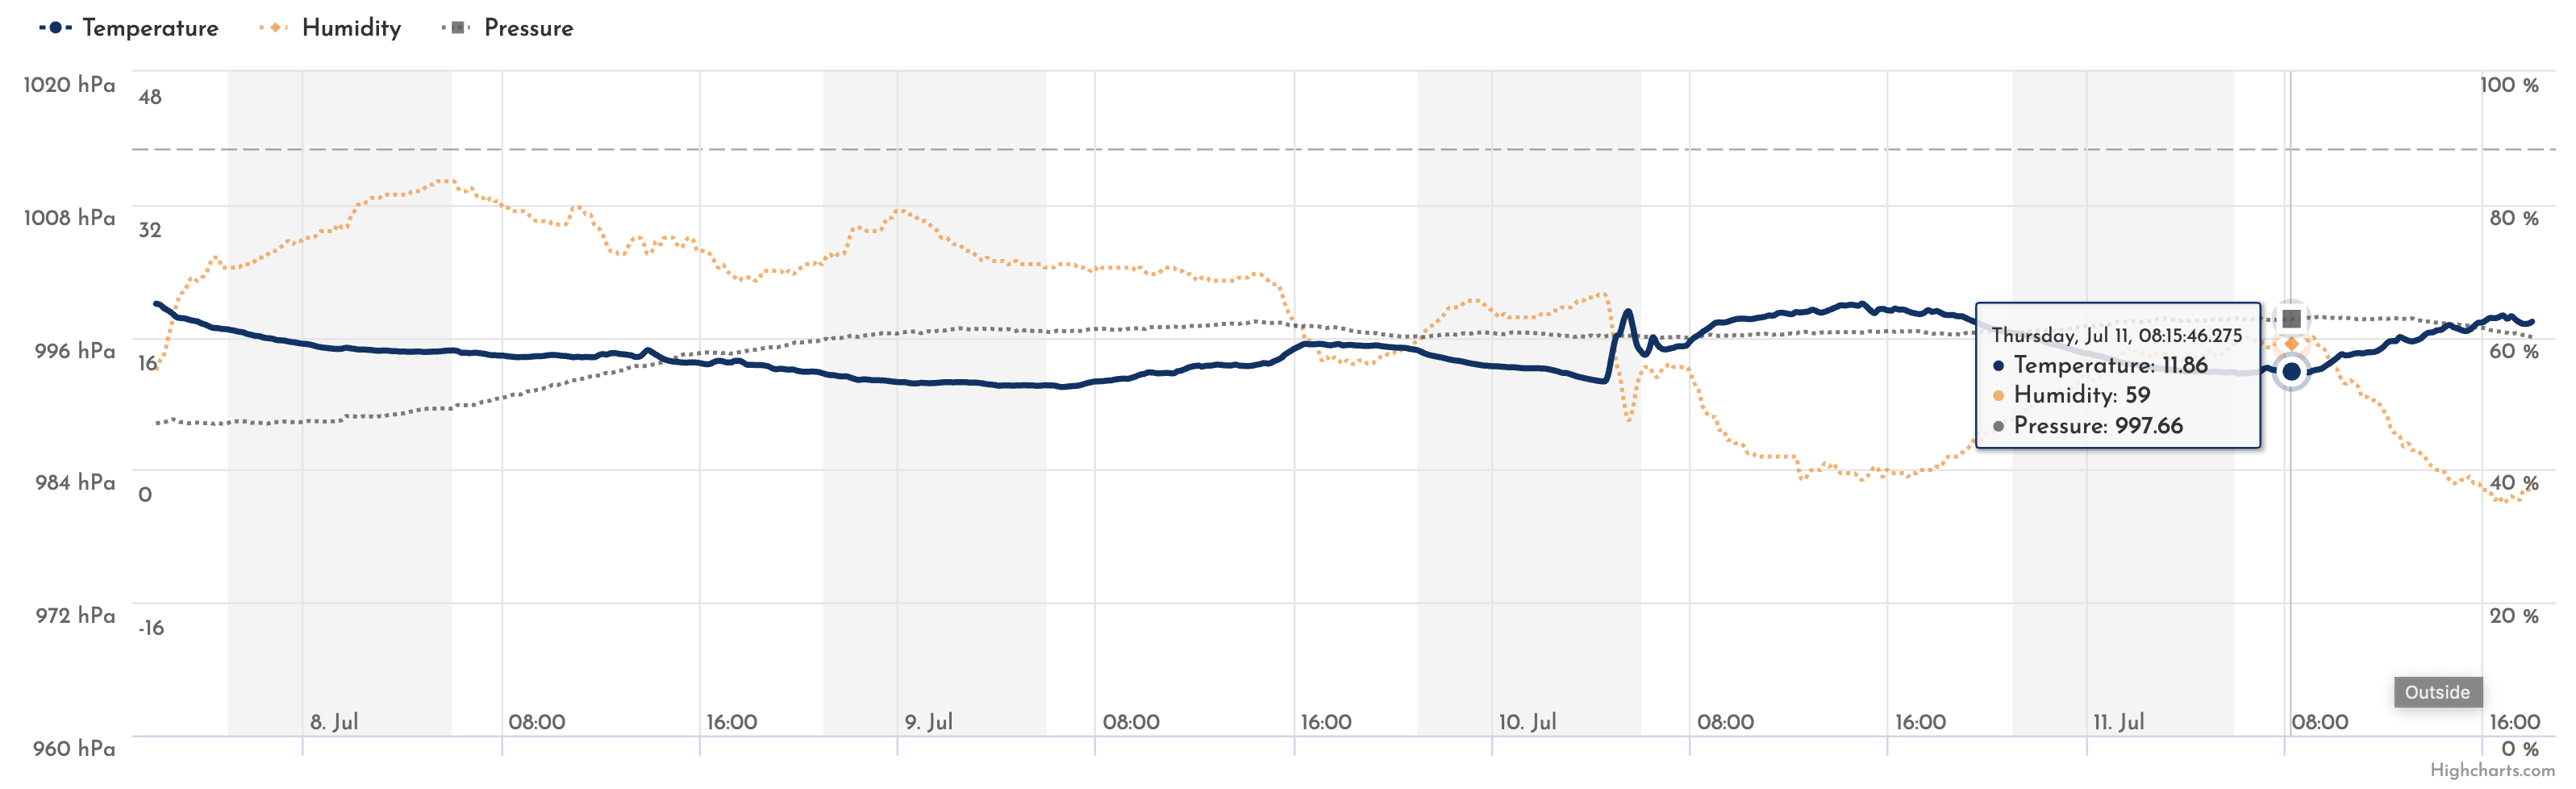
When it comes to official Ruuvi Station app, the recent update seems to fix the background scanning, so now there are more data points collected with it as well.
Off topic: As it can be seen from the charts, the summer has been quite awful in Finland this year when you’re looking at the temperatures, being July and all.