Hello otso, I’m new to Grafana. How do I update the mac addresses? I’m not sure how to update the mac addresses. Can you point me to any resources on this? Or do you have instructions on how to do that?
I tried updating the mac addresses via the drop-downs, I think, of my 4 ruuvitags (running latest weather firmware; tried both in normal mode and high precision) in Temperature dashboard but I think it broke it. Not sure what I did wrong of if that is how to do it.
hcitool lescan shows my tags are broadcasting and the pi3 can see the tags. Thanks
It looks my rvitag mac addresses show up under the drop down menus, along with the 4 previous build mac addresses, do I simply change those to mine? When I do change those mac address to mine there isn’t any data posting.
Wow, perfect, thanks. I forgot to change admin in Grafana thanks. I also thought it was updating the dashboards automatically, but it wasn’t, so I had to change it to a new range (last 15 minutes) that proved the updates were working. Thanks.
Do you know if Ruuvi is going to allow remote query timing? Right now in high precision it updates fast but grafana is only pulling in every 10 seconds. It’d be good to be able to tell the rtags how often you want to get a sensor read. Do you know if that is in the works and/or possible?
The throttling you are seeing is intentional on the RuuviCollector, by default it will save at most one measurement per tag per 9.9 seconds. You can change this setting from the configuration file: ruuvi-collector.properties which is located in the same directory as the ruuvicollector .jar file. If the configuration file does not exist, you can create it and enter the values manually. The setting controlling the update limit is influxUpdateLimit which has a default value of 9900 (it’s in milliseconds). You can find more up-to-date information about the config in the example configuration. Don’t forget to restart the RuuviCollector after creating/changing the configuration
The reason for this kind of limiting is to avoid too many values getting persisted, especially if running slow hardware like the raspberry pi, or if you are collecting measurements from a lot of tags, so you should experiment with different limits like 1 second or 100 milliseconds to see what fits your needs and work with your setup.
Is there a way to set the tag read rate so to reduce power consumption? I’m wondering only to calculate the life of the tag in high-precision mode.
Do you know the power usage level of the tag in high precision mode? I did see the Trello post regarding power usage: "Applications generally use ~2-10 µA while idle, ~1.3 µA on shutdown. Peak currents can reach ~13 µA when radio is operated."
Thanks, and the ruuvitags are awesome.
Transmitting the values is what consumes the most power, if I recall correctly, at 10s transmission interval the average power consumption is <8µA, which means about 8.5 years with the battery that’s shipped with the tag. The reality less though, especially since the shelf life of lithium batteries is 5-8 years, closer to 8 years with the size used by the tags. The transmission interval can be changed in bluetooth_config.h
Hi everybody.
Sorry for my poor english, but i’m French
I have 2 tags in raw mode (I verify it with the android application). I change the mac adress to chose these 2 tags ( mac adress appear autmatically in the dropdown menu, so I think the raspberry has seen the 2 tags).
But no data appears on the temperature graph in Grafana even If I force the update.
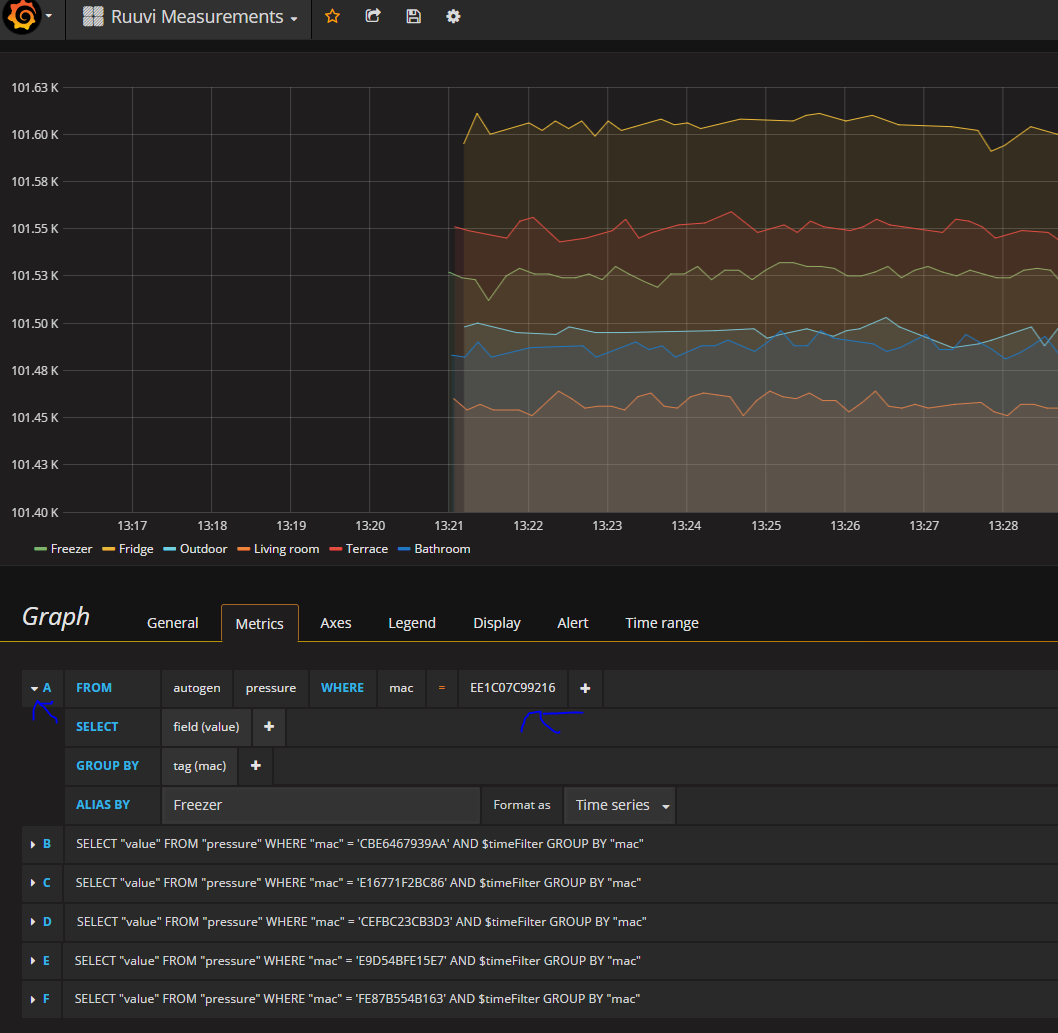
First, you should verify that you have the right time and date on the raspberry, as the metrics are stored using the time on the raspberry pi.
Second thing to try is to set a lower limit in the “Group by time interval:” near the bottom of the page, this value should be roughly the same or little higher as the measurement collection interval, for example “>10s”.
Setting too low value may create unwanted gaps in the graph or make the entire graph invisible, and too high value will make the graph resolution low.
Clock was OK. The problem was with the period of time displayed. It was stay on the period of may 2017.
In changing to displqy thisday, all the value of my tag appear :)
I’m happy. I 'm going to continue to deal with this tag.
How to access to the other parameters, acceleration for example ?
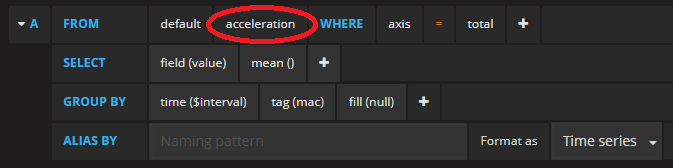
Create another Graph panel (or any other panel type you want) and choose another metric type in the “FROM” section:
With acceleration, remember to either choose a specific axis (or total) in the “WHERE” section or use the “GROUP BY” functionality, otherwise Grafana don’t know how to interpret the values for different axes properly and you will end up with incorrect values on the graph.
Thanks Scrin.
I’ve understood that Grafana present the data which are stored in influxDB by a script.
As I want to developp a system on my raspberry to receive acceleration, make some tests to know if the tag has moved, then send SMS or email, could you say me where is the script wich received the data (in what directory) in order to you as a model for my own script ?
Other question. Is it possible to program the tag to send acceleration just when the tag moves, rather than monitoring on the raspberry all the time the data received and comput to know if the accelaration has changed ?
Cyril
Send acceleration only when tag moves would have some issues with parsing, since you’d have variable-length data fields. You could consider sending another “moving” byte instead.
The source code for the reading, parsing and putting to InfluxDB can be found on my Github, here, it’s written in Java. You can use that as an example if you want to create your own “notifier script” or look up other alternatives. Basically my code just uses hcidump to read the data, and then just parse the output.
I started hacking on something last night to do exactly this. RuuviCollector shells out to a Linux-only program, and I’m working on macOS. I whipped up https://github.com/blalor/ruuvi-to-influxdb in node.js; it uses node-ruuvitag which is more cross-platform. I did find that the tag IDs change depending on where I run it from; not sure what’s up with that… It reads a config file that provides a label based on the tag ID, so the point in influxdb has a label tag such as “outside” or “downstairs”. It’s working well for me so far.
How do you take the Tag ID? If the ID is given by the stack, the ID is at least pseudo-random on some platforms.
Generally using MAC address as ID is reliable.
The tag ID comes from noble via node-ruuvitag. I’ve run my script on a MacBook Pro running Sierra (10.12.6) and a Mac mini (still) running Yosemite (10.10.5). It appears that noble uses the same bluetooth bindings for both, but there are perhaps underlying differences in the hardware or OS that cause a different UUID to be presented. That doesn’t make any sense to me, either, but that’s my experience.
Ok Scrin. I think initially that it was python script which was used to listen the tag.
I prefer java to program
I 'm going to look at your code to make an adaptation for my needs.
I 'll comme back to you I think if I 've other questions